Human T-cell leukemia virus type I
Taxonomy: Viruses; Riboviria; Pararnavirae; Artverviricota; Revtraviricetes; Ortervirales; Retroviridae; Orthoretrovirinae; Deltaretrovirus; Primate T-lymphotropic virus 1
Average proteome isoelectric point is 8.3
Get precalculated fractions of proteins

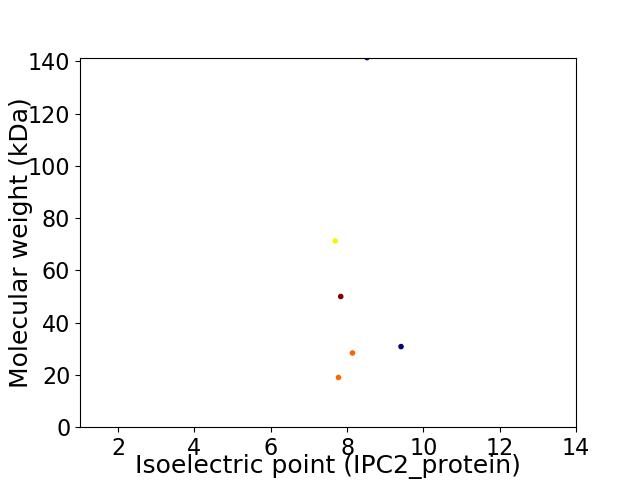
Virtual 2D-PAGE plot for 6 proteins (isoelectric point calculated using IPC2_protein)
Get csv file with sequences according to given criteria:
* You can choose from 21 different methods for calculating isoelectric point
Summary statistics related to proteome-wise predictions


Protein with the lowest isoelectric point:
>tr|Q9QRA0|Q9QRA0_9DELA Pr55 OS=Human T-cell leukemia virus type I OX=11908 GN=gag PE=4 SV=1
MM1 pKa = 7.1GQIFSRR7 pKa = 11.84SASPIPRR14 pKa = 11.84PPRR17 pKa = 11.84GLAAHH22 pKa = 6.78HH23 pKa = 6.5WLNFLQAAYY32 pKa = 9.85RR33 pKa = 11.84LEE35 pKa = 4.84PGPSSYY41 pKa = 11.22DD42 pKa = 2.96FHH44 pKa = 7.48QLKK47 pKa = 10.4KK48 pKa = 9.78FLKK51 pKa = 9.64IALEE55 pKa = 4.29TPVWICPINYY65 pKa = 9.78SLLASLLPKK74 pKa = 10.35GYY76 pKa = 9.08PGRR79 pKa = 11.84VNEE82 pKa = 4.56ILHH85 pKa = 6.71ILIQTQAQIPSRR97 pKa = 11.84PAPPPPSSPTHH108 pKa = 6.9DD109 pKa = 4.84PPDD112 pKa = 4.45SDD114 pKa = 3.85PQIPPPYY121 pKa = 9.76VEE123 pKa = 3.98PTAPQVLPVMHH134 pKa = 6.63PHH136 pKa = 6.98GAPPNHH142 pKa = 6.93RR143 pKa = 11.84PWQMKK148 pKa = 9.69DD149 pKa = 2.99LQAIKK154 pKa = 10.71QEE156 pKa = 4.25VSQAAPGSPQFMQTIRR172 pKa = 11.84LAVQQFDD179 pKa = 3.87PTAKK183 pKa = 10.47DD184 pKa = 3.57LQDD187 pKa = 3.86LLQYY191 pKa = 10.75LCSSLVASLHH201 pKa = 5.42HH202 pKa = 5.87QQLDD206 pKa = 3.83SLISEE211 pKa = 4.46AEE213 pKa = 3.97TRR215 pKa = 11.84GITGYY220 pKa = 10.89NPLAGPLRR228 pKa = 11.84VQANNPQQQGLRR240 pKa = 11.84RR241 pKa = 11.84EE242 pKa = 4.26YY243 pKa = 9.9QQLWLAAFAALPGSAKK259 pKa = 10.5DD260 pKa = 3.88PSWASILQGLEE271 pKa = 3.81EE272 pKa = 4.99PYY274 pKa = 10.27HH275 pKa = 6.84AFVEE279 pKa = 4.37RR280 pKa = 11.84LNIALDD286 pKa = 3.48NGLPEE291 pKa = 4.72GTPKK295 pKa = 11.01DD296 pKa = 3.86PILRR300 pKa = 11.84SLAYY304 pKa = 10.58SNANKK309 pKa = 9.97EE310 pKa = 4.36CQKK313 pKa = 10.72LLQARR318 pKa = 11.84GHH320 pKa = 5.64TNSPLGDD327 pKa = 3.73MLRR330 pKa = 11.84ACQTWTPKK338 pKa = 10.94DD339 pKa = 3.35KK340 pKa = 11.09TKK342 pKa = 11.14VLVVQPKK349 pKa = 9.84KK350 pKa = 10.29PPPNQPCFRR359 pKa = 11.84CGKK362 pKa = 9.0AGHH365 pKa = 6.84WSRR368 pKa = 11.84DD369 pKa = 3.59CTQPRR374 pKa = 11.84PPPGPCPLCQDD385 pKa = 3.33PTHH388 pKa = 7.23WKK390 pKa = 9.79RR391 pKa = 11.84DD392 pKa = 3.78CPRR395 pKa = 11.84LKK397 pKa = 9.7PTIPEE402 pKa = 4.22PEE404 pKa = 4.26PEE406 pKa = 4.01EE407 pKa = 4.68DD408 pKa = 5.51ALLLDD413 pKa = 4.9LPTDD417 pKa = 3.5IPHH420 pKa = 7.28PKK422 pKa = 9.25NLHH425 pKa = 5.93RR426 pKa = 11.84GGPPTLQQVLPNQDD440 pKa = 3.5PASILPVIPLDD451 pKa = 3.43PARR454 pKa = 11.84RR455 pKa = 11.84PVIKK459 pKa = 10.44AQVDD463 pKa = 3.92TQTSHH468 pKa = 7.24PKK470 pKa = 9.78TIEE473 pKa = 3.9ALLDD477 pKa = 3.16TGADD481 pKa = 3.45MTVLPIALFSSNTPLKK497 pKa = 8.74NTSVLGAGGQTQDD510 pKa = 3.23HH511 pKa = 6.83FKK513 pKa = 10.1LTSLPVLIRR522 pKa = 11.84LPFRR526 pKa = 11.84TTPIVLTSCLVDD538 pKa = 3.61TKK540 pKa = 11.41NNWAIIGRR548 pKa = 11.84DD549 pKa = 3.68ALQQCQGVLYY559 pKa = 10.32LPEE562 pKa = 5.01AKK564 pKa = 9.97GPPVILPIQAPAVLGLEE581 pKa = 4.13HH582 pKa = 7.29LPRR585 pKa = 11.84PPEE588 pKa = 3.87ISQFPLNQNASRR600 pKa = 11.84PCNTWSGRR608 pKa = 11.84PWRR611 pKa = 11.84QAISNPTPGQEE622 pKa = 3.39ITQYY626 pKa = 10.52SQLKK630 pKa = 9.83RR631 pKa = 11.84PMEE634 pKa = 4.85PGDD637 pKa = 3.64SSTTCGPLTLL647 pKa = 4.79
MM1 pKa = 7.1GQIFSRR7 pKa = 11.84SASPIPRR14 pKa = 11.84PPRR17 pKa = 11.84GLAAHH22 pKa = 6.78HH23 pKa = 6.5WLNFLQAAYY32 pKa = 9.85RR33 pKa = 11.84LEE35 pKa = 4.84PGPSSYY41 pKa = 11.22DD42 pKa = 2.96FHH44 pKa = 7.48QLKK47 pKa = 10.4KK48 pKa = 9.78FLKK51 pKa = 9.64IALEE55 pKa = 4.29TPVWICPINYY65 pKa = 9.78SLLASLLPKK74 pKa = 10.35GYY76 pKa = 9.08PGRR79 pKa = 11.84VNEE82 pKa = 4.56ILHH85 pKa = 6.71ILIQTQAQIPSRR97 pKa = 11.84PAPPPPSSPTHH108 pKa = 6.9DD109 pKa = 4.84PPDD112 pKa = 4.45SDD114 pKa = 3.85PQIPPPYY121 pKa = 9.76VEE123 pKa = 3.98PTAPQVLPVMHH134 pKa = 6.63PHH136 pKa = 6.98GAPPNHH142 pKa = 6.93RR143 pKa = 11.84PWQMKK148 pKa = 9.69DD149 pKa = 2.99LQAIKK154 pKa = 10.71QEE156 pKa = 4.25VSQAAPGSPQFMQTIRR172 pKa = 11.84LAVQQFDD179 pKa = 3.87PTAKK183 pKa = 10.47DD184 pKa = 3.57LQDD187 pKa = 3.86LLQYY191 pKa = 10.75LCSSLVASLHH201 pKa = 5.42HH202 pKa = 5.87QQLDD206 pKa = 3.83SLISEE211 pKa = 4.46AEE213 pKa = 3.97TRR215 pKa = 11.84GITGYY220 pKa = 10.89NPLAGPLRR228 pKa = 11.84VQANNPQQQGLRR240 pKa = 11.84RR241 pKa = 11.84EE242 pKa = 4.26YY243 pKa = 9.9QQLWLAAFAALPGSAKK259 pKa = 10.5DD260 pKa = 3.88PSWASILQGLEE271 pKa = 3.81EE272 pKa = 4.99PYY274 pKa = 10.27HH275 pKa = 6.84AFVEE279 pKa = 4.37RR280 pKa = 11.84LNIALDD286 pKa = 3.48NGLPEE291 pKa = 4.72GTPKK295 pKa = 11.01DD296 pKa = 3.86PILRR300 pKa = 11.84SLAYY304 pKa = 10.58SNANKK309 pKa = 9.97EE310 pKa = 4.36CQKK313 pKa = 10.72LLQARR318 pKa = 11.84GHH320 pKa = 5.64TNSPLGDD327 pKa = 3.73MLRR330 pKa = 11.84ACQTWTPKK338 pKa = 10.94DD339 pKa = 3.35KK340 pKa = 11.09TKK342 pKa = 11.14VLVVQPKK349 pKa = 9.84KK350 pKa = 10.29PPPNQPCFRR359 pKa = 11.84CGKK362 pKa = 9.0AGHH365 pKa = 6.84WSRR368 pKa = 11.84DD369 pKa = 3.59CTQPRR374 pKa = 11.84PPPGPCPLCQDD385 pKa = 3.33PTHH388 pKa = 7.23WKK390 pKa = 9.79RR391 pKa = 11.84DD392 pKa = 3.78CPRR395 pKa = 11.84LKK397 pKa = 9.7PTIPEE402 pKa = 4.22PEE404 pKa = 4.26PEE406 pKa = 4.01EE407 pKa = 4.68DD408 pKa = 5.51ALLLDD413 pKa = 4.9LPTDD417 pKa = 3.5IPHH420 pKa = 7.28PKK422 pKa = 9.25NLHH425 pKa = 5.93RR426 pKa = 11.84GGPPTLQQVLPNQDD440 pKa = 3.5PASILPVIPLDD451 pKa = 3.43PARR454 pKa = 11.84RR455 pKa = 11.84PVIKK459 pKa = 10.44AQVDD463 pKa = 3.92TQTSHH468 pKa = 7.24PKK470 pKa = 9.78TIEE473 pKa = 3.9ALLDD477 pKa = 3.16TGADD481 pKa = 3.45MTVLPIALFSSNTPLKK497 pKa = 8.74NTSVLGAGGQTQDD510 pKa = 3.23HH511 pKa = 6.83FKK513 pKa = 10.1LTSLPVLIRR522 pKa = 11.84LPFRR526 pKa = 11.84TTPIVLTSCLVDD538 pKa = 3.61TKK540 pKa = 11.41NNWAIIGRR548 pKa = 11.84DD549 pKa = 3.68ALQQCQGVLYY559 pKa = 10.32LPEE562 pKa = 5.01AKK564 pKa = 9.97GPPVILPIQAPAVLGLEE581 pKa = 4.13HH582 pKa = 7.29LPRR585 pKa = 11.84PPEE588 pKa = 3.87ISQFPLNQNASRR600 pKa = 11.84PCNTWSGRR608 pKa = 11.84PWRR611 pKa = 11.84QAISNPTPGQEE622 pKa = 3.39ITQYY626 pKa = 10.52SQLKK630 pKa = 9.83RR631 pKa = 11.84PMEE634 pKa = 4.85PGDD637 pKa = 3.64SSTTCGPLTLL647 pKa = 4.79
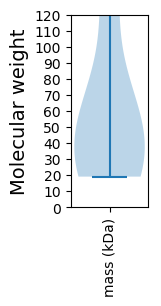
Molecular weight: 71.26 kDa
Isoelectric point according different methods:
Protein with the highest isoelectric point:
>tr|Q9QR97|Q9QR97_9DELA p40 OS=Human T-cell leukemia virus type I OX=11908 GN=tax PE=3 SV=1
MM1 pKa = 7.51GKK3 pKa = 9.97FLTTLILFFQFCPLILGDD21 pKa = 4.58YY22 pKa = 10.57SPSCCTLTIGVSSYY36 pKa = 10.86HH37 pKa = 6.73SKK39 pKa = 10.17PCNPAQPVCSWTLDD53 pKa = 3.88LLALSADD60 pKa = 3.67QALQPPCPNLVGYY73 pKa = 10.13SSYY76 pKa = 10.77HH77 pKa = 4.75ATYY80 pKa = 10.81SLYY83 pKa = 10.83LFPHH87 pKa = 7.5WIKK90 pKa = 10.78KK91 pKa = 8.39PNRR94 pKa = 11.84NGGGYY99 pKa = 10.33YY100 pKa = 9.83SASYY104 pKa = 10.97SDD106 pKa = 4.19PCSLKK111 pKa = 10.57CPYY114 pKa = 10.0LGCQSWTCPYY124 pKa = 8.96TGAVSSPYY132 pKa = 9.8WKK134 pKa = 10.19FQQDD138 pKa = 3.56VNFTQEE144 pKa = 3.75VSRR147 pKa = 11.84LNINLHH153 pKa = 5.46FSKK156 pKa = 10.67CGFSLLPSSRR166 pKa = 11.84RR167 pKa = 11.84SRR169 pKa = 11.84II170 pKa = 3.3
MM1 pKa = 7.51GKK3 pKa = 9.97FLTTLILFFQFCPLILGDD21 pKa = 4.58YY22 pKa = 10.57SPSCCTLTIGVSSYY36 pKa = 10.86HH37 pKa = 6.73SKK39 pKa = 10.17PCNPAQPVCSWTLDD53 pKa = 3.88LLALSADD60 pKa = 3.67QALQPPCPNLVGYY73 pKa = 10.13SSYY76 pKa = 10.77HH77 pKa = 4.75ATYY80 pKa = 10.81SLYY83 pKa = 10.83LFPHH87 pKa = 7.5WIKK90 pKa = 10.78KK91 pKa = 8.39PNRR94 pKa = 11.84NGGGYY99 pKa = 10.33YY100 pKa = 9.83SASYY104 pKa = 10.97SDD106 pKa = 4.19PCSLKK111 pKa = 10.57CPYY114 pKa = 10.0LGCQSWTCPYY124 pKa = 8.96TGAVSSPYY132 pKa = 9.8WKK134 pKa = 10.19FQQDD138 pKa = 3.56VNFTQEE144 pKa = 3.75VSRR147 pKa = 11.84LNINLHH153 pKa = 5.46FSKK156 pKa = 10.67CGFSLLPSSRR166 pKa = 11.84RR167 pKa = 11.84SRR169 pKa = 11.84II170 pKa = 3.3
Molecular weight: 19.04 kDa
Isoelectric point according different methods:
Peptides (in silico digests for buttom-up proteomics)
Below you can find in silico digests of the whole proteome with Trypsin, Chymotrypsin, Trypsin+LysC, LysN, ArgC proteases suitable for different mass spec machines.| Try ESI |
 |
|---|
| ChTry ESI |
 |
|---|
| ArgC ESI |
 |
|---|
| LysN ESI |
 |
|---|
| TryLysC ESI |
 |
|---|
| Try MALDI |
 |
|---|
| ChTry MALDI |
 |
|---|
| ArgC MALDI |
 |
|---|
| LysN MALDI |
 |
|---|
| TryLysC MALDI |
 |
|---|
| Try LTQ |
 |
|---|
| ChTry LTQ |
 |
|---|
| ArgC LTQ |
 |
|---|
| LysN LTQ |
 |
|---|
| TryLysC LTQ |
 |
|---|
| Try MSlow |
 |
|---|
| ChTry MSlow |
 |
|---|
| ArgC MSlow |
 |
|---|
| LysN MSlow |
 |
|---|
| TryLysC MSlow |
 |
|---|
| Try MShigh |
 |
|---|
| ChTry MShigh |
 |
|---|
| ArgC MShigh |
 |
|---|
| LysN MShigh |
 |
|---|
| TryLysC MShigh |
 |
|---|
General Statistics
Number of major isoforms |
Number of additional isoforms |
Number of all proteins |
Number of amino acids |
Min. Seq. Length |
Max. Seq. Length |
Avg. Seq. Length |
Avg. Mol. Weight |
|---|---|---|---|---|---|---|---|
0 |
3068 |
170 |
1273 |
511.3 |
56.82 |
Amino acid frequency
Ala |
Cys |
Asp |
Glu |
Phe |
Gly |
His |
Ile |
Lys |
Leu |
|---|---|---|---|---|---|---|---|---|---|
6.812 ± 0.445 | 2.379 ± 0.437 |
3.716 ± 0.27 | 2.803 ± 0.296 |
3.194 ± 0.414 | 5.28 ± 0.315 |
3.585 ± 0.278 | 4.889 ± 0.174 |
3.944 ± 0.225 | 12.907 ± 0.566 |
Met |
Asn |
Gln |
Pro |
Arg |
Ser |
Thr |
Val |
Trp |
Tyr |
|---|---|---|---|---|---|---|---|---|---|
1.141 ± 0.128 | 3.162 ± 0.207 |
12.581 ± 0.806 | 7.236 ± 0.407 |
4.857 ± 0.239 | 6.845 ± 0.573 |
6.389 ± 0.495 | 3.814 ± 0.173 |
1.793 ± 0.093 | 2.673 ± 0.457 |
Most of the basic statistics you can see at this page can be downloaded from this CSV file
Proteome-pI is available under Creative Commons Attribution-NoDerivs license, for more details see here
| Reference: Kozlowski LP. Proteome-pI 2.0: Proteome Isoelectric Point Database Update. Nucleic Acids Res. 2021, doi: 10.1093/nar/gkab944 | Contact: Lukasz P. Kozlowski |
