Marinomonas mediterranea (strain ATCC 700492 / JCM 21426 / NBRC 103028 / MMB-1)
Taxonomy: cellular organisms; Bacteria; Proteobacteria; Gammaproteobacteria; Oceanospirillales; Oceanospirillaceae; Marinomonas; Marinomonas mediterranea
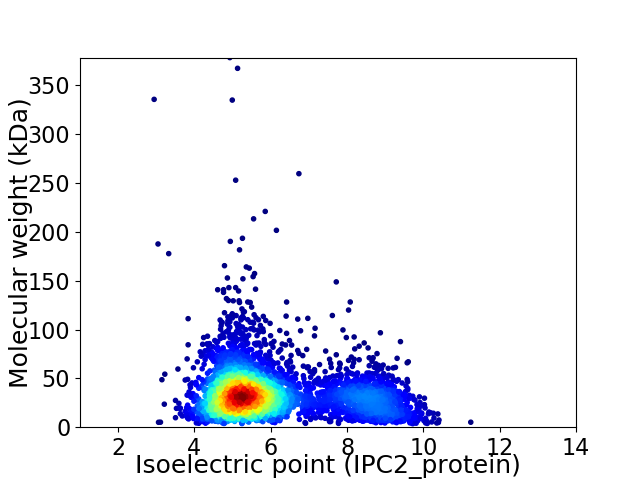
Average proteome isoelectric point is 6.03
Get precalculated fractions of proteins

Virtual 2D-PAGE plot for 4118 proteins (isoelectric point calculated using IPC2_protein)
Get csv file with sequences according to given criteria:
* You can choose from 21 different methods for calculating isoelectric point
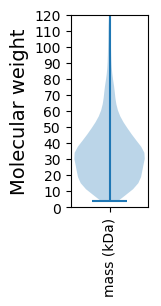
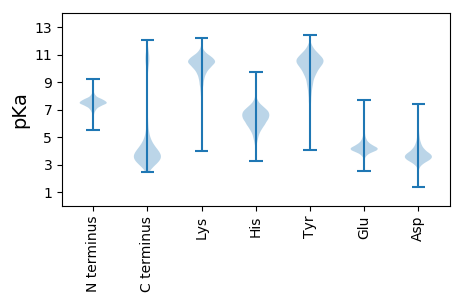
Summary statistics related to proteome-wise predictions


Protein with the lowest isoelectric point:
>tr|F2JYP6|F2JYP6_MARM1 Uncharacterized protein OS=Marinomonas mediterranea (strain ATCC 700492 / JCM 21426 / NBRC 103028 / MMB-1) OX=717774 GN=Marme_0371 PE=4 SV=1
MM1 pKa = 7.06KK2 pKa = 9.82TVLKK6 pKa = 9.58YY7 pKa = 8.9TVQPGDD13 pKa = 4.14SLSKK17 pKa = 10.55IADD20 pKa = 3.73QISASAGITTDD31 pKa = 3.34QIEE34 pKa = 4.23AANPSVVPSALQIGQLLTIPQLDD57 pKa = 3.96TPTNRR62 pKa = 11.84WFYY65 pKa = 10.45TVLSGDD71 pKa = 3.9SFSGIAAALAQCKK84 pKa = 9.93GLTYY88 pKa = 10.9EE89 pKa = 5.51EE90 pKa = 4.75IEE92 pKa = 4.17QDD94 pKa = 3.3NSLTGSTIDD103 pKa = 3.25VGQVLNIPATSSDD116 pKa = 4.81APTQDD121 pKa = 3.19NLAPNAINMGYY132 pKa = 9.5WNWTWSGTSNPSNATLSLAFSGWTDD157 pKa = 3.36PTTALQDD164 pKa = 3.46SHH166 pKa = 6.18QVKK169 pKa = 10.07PSLVGTKK176 pKa = 10.22YY177 pKa = 9.97LTFGGGNDD185 pKa = 3.44NGKK188 pKa = 8.32FTALSLQDD196 pKa = 3.21ITSAIQSGKK205 pKa = 9.93LEE207 pKa = 4.43GYY209 pKa = 9.97EE210 pKa = 4.02GVAYY214 pKa = 10.03DD215 pKa = 3.75VEE217 pKa = 4.72EE218 pKa = 4.84GDD220 pKa = 3.79SHH222 pKa = 8.56LEE224 pKa = 3.47NDD226 pKa = 3.76FAVSFKK232 pKa = 10.48AAKK235 pKa = 10.02DD236 pKa = 3.29AGLKK240 pKa = 10.12VLVTVSHH247 pKa = 6.43SAPYY251 pKa = 10.65GITDD255 pKa = 4.41ADD257 pKa = 3.63ALMQSFFADD266 pKa = 3.56SNIDD270 pKa = 3.63LLSPQLYY277 pKa = 9.0TEE279 pKa = 4.37GDD281 pKa = 3.56EE282 pKa = 4.85TEE284 pKa = 4.65NDD286 pKa = 3.61YY287 pKa = 9.58QTTSGTSTTWEE298 pKa = 4.54DD299 pKa = 3.54YY300 pKa = 11.28ASAKK304 pKa = 9.88AAIVPSIVTSDD315 pKa = 4.33LYY317 pKa = 11.46DD318 pKa = 3.48SATGYY323 pKa = 8.13FTEE326 pKa = 4.95QGVTLAGYY334 pKa = 8.51IQWAQVV340 pKa = 2.84
MM1 pKa = 7.06KK2 pKa = 9.82TVLKK6 pKa = 9.58YY7 pKa = 8.9TVQPGDD13 pKa = 4.14SLSKK17 pKa = 10.55IADD20 pKa = 3.73QISASAGITTDD31 pKa = 3.34QIEE34 pKa = 4.23AANPSVVPSALQIGQLLTIPQLDD57 pKa = 3.96TPTNRR62 pKa = 11.84WFYY65 pKa = 10.45TVLSGDD71 pKa = 3.9SFSGIAAALAQCKK84 pKa = 9.93GLTYY88 pKa = 10.9EE89 pKa = 5.51EE90 pKa = 4.75IEE92 pKa = 4.17QDD94 pKa = 3.3NSLTGSTIDD103 pKa = 3.25VGQVLNIPATSSDD116 pKa = 4.81APTQDD121 pKa = 3.19NLAPNAINMGYY132 pKa = 9.5WNWTWSGTSNPSNATLSLAFSGWTDD157 pKa = 3.36PTTALQDD164 pKa = 3.46SHH166 pKa = 6.18QVKK169 pKa = 10.07PSLVGTKK176 pKa = 10.22YY177 pKa = 9.97LTFGGGNDD185 pKa = 3.44NGKK188 pKa = 8.32FTALSLQDD196 pKa = 3.21ITSAIQSGKK205 pKa = 9.93LEE207 pKa = 4.43GYY209 pKa = 9.97EE210 pKa = 4.02GVAYY214 pKa = 10.03DD215 pKa = 3.75VEE217 pKa = 4.72EE218 pKa = 4.84GDD220 pKa = 3.79SHH222 pKa = 8.56LEE224 pKa = 3.47NDD226 pKa = 3.76FAVSFKK232 pKa = 10.48AAKK235 pKa = 10.02DD236 pKa = 3.29AGLKK240 pKa = 10.12VLVTVSHH247 pKa = 6.43SAPYY251 pKa = 10.65GITDD255 pKa = 4.41ADD257 pKa = 3.63ALMQSFFADD266 pKa = 3.56SNIDD270 pKa = 3.63LLSPQLYY277 pKa = 9.0TEE279 pKa = 4.37GDD281 pKa = 3.56EE282 pKa = 4.85TEE284 pKa = 4.65NDD286 pKa = 3.61YY287 pKa = 9.58QTTSGTSTTWEE298 pKa = 4.54DD299 pKa = 3.54YY300 pKa = 11.28ASAKK304 pKa = 9.88AAIVPSIVTSDD315 pKa = 4.33LYY317 pKa = 11.46DD318 pKa = 3.48SATGYY323 pKa = 8.13FTEE326 pKa = 4.95QGVTLAGYY334 pKa = 8.51IQWAQVV340 pKa = 2.84
Molecular weight: 36.12 kDa
Isoelectric point according different methods:
Protein with the highest isoelectric point:
>tr|F2K1V7|F2K1V7_MARM1 MscS Mechanosensitive ion channel OS=Marinomonas mediterranea (strain ATCC 700492 / JCM 21426 / NBRC 103028 / MMB-1) OX=717774 GN=Marme_0667 PE=3 SV=1
MM1 pKa = 7.45KK2 pKa = 9.51RR3 pKa = 11.84TFQPSVLKK11 pKa = 10.46RR12 pKa = 11.84KK13 pKa = 9.37RR14 pKa = 11.84NHH16 pKa = 5.37GFRR19 pKa = 11.84ARR21 pKa = 11.84MATKK25 pKa = 10.41GGRR28 pKa = 11.84QVIARR33 pKa = 11.84RR34 pKa = 11.84RR35 pKa = 11.84ARR37 pKa = 11.84GRR39 pKa = 11.84KK40 pKa = 8.94ALSAA44 pKa = 4.07
MM1 pKa = 7.45KK2 pKa = 9.51RR3 pKa = 11.84TFQPSVLKK11 pKa = 10.46RR12 pKa = 11.84KK13 pKa = 9.37RR14 pKa = 11.84NHH16 pKa = 5.37GFRR19 pKa = 11.84ARR21 pKa = 11.84MATKK25 pKa = 10.41GGRR28 pKa = 11.84QVIARR33 pKa = 11.84RR34 pKa = 11.84RR35 pKa = 11.84ARR37 pKa = 11.84GRR39 pKa = 11.84KK40 pKa = 8.94ALSAA44 pKa = 4.07
Molecular weight: 5.11 kDa
Isoelectric point according different methods:
Peptides (in silico digests for buttom-up proteomics)
Below you can find in silico digests of the whole proteome with Trypsin, Chymotrypsin, Trypsin+LysC, LysN, ArgC proteases suitable for different mass spec machines.| Try ESI |
 |
|---|
| ChTry ESI |
 |
|---|
| ArgC ESI |
 |
|---|
| LysN ESI |
 |
|---|
| TryLysC ESI |
 |
|---|
| Try MALDI |
 |
|---|
| ChTry MALDI |
 |
|---|
| ArgC MALDI |
 |
|---|
| LysN MALDI |
 |
|---|
| TryLysC MALDI |
 |
|---|
| Try LTQ |
 |
|---|
| ChTry LTQ |
 |
|---|
| ArgC LTQ |
 |
|---|
| LysN LTQ |
 |
|---|
| TryLysC LTQ |
 |
|---|
| Try MSlow |
 |
|---|
| ChTry MSlow |
 |
|---|
| ArgC MSlow |
 |
|---|
| LysN MSlow |
 |
|---|
| TryLysC MSlow |
 |
|---|
| Try MShigh |
 |
|---|
| ChTry MShigh |
 |
|---|
| ArgC MShigh |
 |
|---|
| LysN MShigh |
 |
|---|
| TryLysC MShigh |
 |
|---|
General Statistics
Number of major isoforms |
Number of additional isoforms |
Number of all proteins |
Number of amino acids |
Min. Seq. Length |
Max. Seq. Length |
Avg. Seq. Length |
Avg. Mol. Weight |
|---|---|---|---|---|---|---|---|
0 |
1345423 |
30 |
3387 |
326.7 |
36.26 |
Amino acid frequency
Ala |
Cys |
Asp |
Glu |
Phe |
Gly |
His |
Ile |
Lys |
Leu |
|---|---|---|---|---|---|---|---|---|---|
8.417 ± 0.042 | 1.007 ± 0.012 |
5.674 ± 0.031 | 6.475 ± 0.033 |
4.151 ± 0.029 | 6.717 ± 0.032 |
2.197 ± 0.019 | 6.319 ± 0.034 |
5.323 ± 0.035 | 10.438 ± 0.044 |
Met |
Asn |
Gln |
Pro |
Arg |
Ser |
Thr |
Val |
Trp |
Tyr |
|---|---|---|---|---|---|---|---|---|---|
2.518 ± 0.018 | 4.175 ± 0.024 |
3.87 ± 0.021 | 4.097 ± 0.03 |
4.604 ± 0.031 | 7.349 ± 0.038 |
5.412 ± 0.037 | 7.024 ± 0.033 |
1.229 ± 0.013 | 3.003 ± 0.02 |
Most of the basic statistics you can see at this page can be downloaded from this CSV file
Proteome-pI is available under Creative Commons Attribution-NoDerivs license, for more details see here
| Reference: Kozlowski LP. Proteome-pI 2.0: Proteome Isoelectric Point Database Update. Nucleic Acids Res. 2021, doi: 10.1093/nar/gkab944 | Contact: Lukasz P. Kozlowski |
