Lactobacillus amylolyticus DSM 11664
Taxonomy: cellular organisms; Bacteria; Terrabacteria group; Firmicutes; Bacilli; Lactobacillales; Lactobacillaceae; Lactobacillus; Lactobacillus amylolyticus
Average proteome isoelectric point is 7.14
Get precalculated fractions of proteins

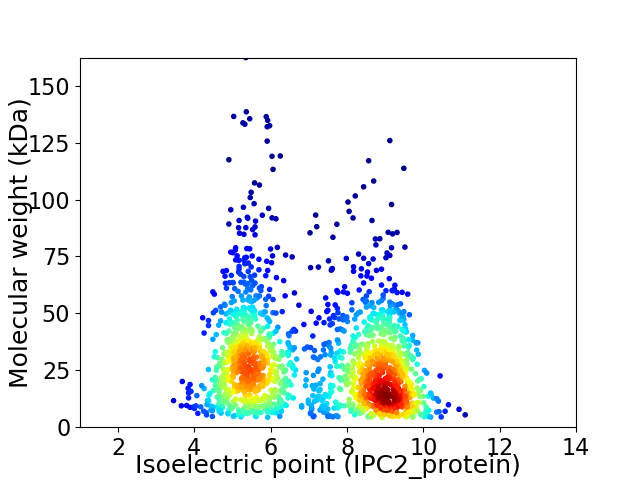
Virtual 2D-PAGE plot for 1684 proteins (isoelectric point calculated using IPC2_protein)
Get csv file with sequences according to given criteria:
* You can choose from 21 different methods for calculating isoelectric point
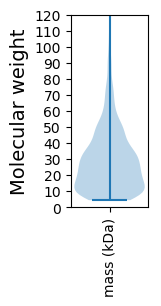
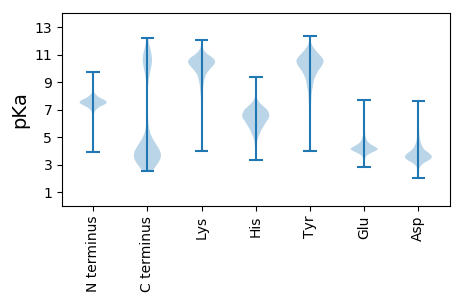
Summary statistics related to proteome-wise predictions


Protein with the lowest isoelectric point:
>tr|D4YUI2|D4YUI2_9LACO Uncharacterized protein OS=Lactobacillus amylolyticus DSM 11664 OX=585524 GN=HMPREF0493_1193 PE=4 SV=1
MM1 pKa = 7.84DD2 pKa = 4.84AVFNTVFSGDD12 pKa = 3.14QTMIPSSIKK21 pKa = 9.88IYY23 pKa = 9.94EE24 pKa = 4.41VPSDD28 pKa = 3.73MAVDD32 pKa = 4.24DD33 pKa = 4.2SGDD36 pKa = 3.19RR37 pKa = 11.84HH38 pKa = 6.96NEE40 pKa = 3.37DD41 pKa = 4.17DD42 pKa = 4.55QYY44 pKa = 11.47IDD46 pKa = 4.36PSDD49 pKa = 3.66PTQQATYY56 pKa = 9.5YY57 pKa = 10.64NKK59 pKa = 8.58ITAGTPDD66 pKa = 3.59TAFKK70 pKa = 10.88NYY72 pKa = 10.18LLAHH76 pKa = 5.23VTYY79 pKa = 10.73DD80 pKa = 4.24EE81 pKa = 4.25NGKK84 pKa = 9.59PNGFAVDD91 pKa = 3.71QSSDD95 pKa = 3.17GLFNIDD101 pKa = 4.02GNTDD105 pKa = 3.84YY106 pKa = 11.43ASHH109 pKa = 7.18AYY111 pKa = 9.58FIQVDD116 pKa = 3.9TVMNDD121 pKa = 3.24PNKK124 pKa = 10.78APGDD128 pKa = 3.65GTTITTHH135 pKa = 6.4TSQTLNGTGITLDD148 pKa = 4.09DD149 pKa = 3.92TEE151 pKa = 4.53SWTGAVTGNGGGQNQTEE168 pKa = 4.2AAHH171 pKa = 6.12VRR173 pKa = 11.84FF174 pKa = 4.48
MM1 pKa = 7.84DD2 pKa = 4.84AVFNTVFSGDD12 pKa = 3.14QTMIPSSIKK21 pKa = 9.88IYY23 pKa = 9.94EE24 pKa = 4.41VPSDD28 pKa = 3.73MAVDD32 pKa = 4.24DD33 pKa = 4.2SGDD36 pKa = 3.19RR37 pKa = 11.84HH38 pKa = 6.96NEE40 pKa = 3.37DD41 pKa = 4.17DD42 pKa = 4.55QYY44 pKa = 11.47IDD46 pKa = 4.36PSDD49 pKa = 3.66PTQQATYY56 pKa = 9.5YY57 pKa = 10.64NKK59 pKa = 8.58ITAGTPDD66 pKa = 3.59TAFKK70 pKa = 10.88NYY72 pKa = 10.18LLAHH76 pKa = 5.23VTYY79 pKa = 10.73DD80 pKa = 4.24EE81 pKa = 4.25NGKK84 pKa = 9.59PNGFAVDD91 pKa = 3.71QSSDD95 pKa = 3.17GLFNIDD101 pKa = 4.02GNTDD105 pKa = 3.84YY106 pKa = 11.43ASHH109 pKa = 7.18AYY111 pKa = 9.58FIQVDD116 pKa = 3.9TVMNDD121 pKa = 3.24PNKK124 pKa = 10.78APGDD128 pKa = 3.65GTTITTHH135 pKa = 6.4TSQTLNGTGITLDD148 pKa = 4.09DD149 pKa = 3.92TEE151 pKa = 4.53SWTGAVTGNGGGQNQTEE168 pKa = 4.2AAHH171 pKa = 6.12VRR173 pKa = 11.84FF174 pKa = 4.48
Molecular weight: 18.77 kDa
Isoelectric point according different methods:
Protein with the highest isoelectric point:
>tr|D4YSI2|D4YSI2_9LACO FAD_binding_2 domain-containing protein OS=Lactobacillus amylolyticus DSM 11664 OX=585524 GN=HMPREF0493_0460 PE=4 SV=1
MM1 pKa = 7.87PKK3 pKa = 9.59MKK5 pKa = 8.8THH7 pKa = 6.78RR8 pKa = 11.84ASAKK12 pKa = 9.47RR13 pKa = 11.84FKK15 pKa = 10.03RR16 pKa = 11.84TANGGLKK23 pKa = 9.5RR24 pKa = 11.84HH25 pKa = 6.15HH26 pKa = 7.23AFTGHH31 pKa = 6.77RR32 pKa = 11.84FHH34 pKa = 7.54GKK36 pKa = 6.24TKK38 pKa = 9.47KK39 pKa = 9.37QRR41 pKa = 11.84RR42 pKa = 11.84HH43 pKa = 4.45LRR45 pKa = 11.84KK46 pKa = 8.75AAMVSRR52 pKa = 11.84SDD54 pKa = 3.45MKK56 pKa = 10.58RR57 pKa = 11.84IKK59 pKa = 10.66QMLSQMRR66 pKa = 3.59
MM1 pKa = 7.87PKK3 pKa = 9.59MKK5 pKa = 8.8THH7 pKa = 6.78RR8 pKa = 11.84ASAKK12 pKa = 9.47RR13 pKa = 11.84FKK15 pKa = 10.03RR16 pKa = 11.84TANGGLKK23 pKa = 9.5RR24 pKa = 11.84HH25 pKa = 6.15HH26 pKa = 7.23AFTGHH31 pKa = 6.77RR32 pKa = 11.84FHH34 pKa = 7.54GKK36 pKa = 6.24TKK38 pKa = 9.47KK39 pKa = 9.37QRR41 pKa = 11.84RR42 pKa = 11.84HH43 pKa = 4.45LRR45 pKa = 11.84KK46 pKa = 8.75AAMVSRR52 pKa = 11.84SDD54 pKa = 3.45MKK56 pKa = 10.58RR57 pKa = 11.84IKK59 pKa = 10.66QMLSQMRR66 pKa = 3.59
Molecular weight: 7.87 kDa
Isoelectric point according different methods:
Peptides (in silico digests for buttom-up proteomics)
Below you can find in silico digests of the whole proteome with Trypsin, Chymotrypsin, Trypsin+LysC, LysN, ArgC proteases suitable for different mass spec machines.| Try ESI |
 |
|---|
| ChTry ESI |
 |
|---|
| ArgC ESI |
 |
|---|
| LysN ESI |
 |
|---|
| TryLysC ESI |
 |
|---|
| Try MALDI |
 |
|---|
| ChTry MALDI |
 |
|---|
| ArgC MALDI |
 |
|---|
| LysN MALDI |
 |
|---|
| TryLysC MALDI |
 |
|---|
| Try LTQ |
 |
|---|
| ChTry LTQ |
 |
|---|
| ArgC LTQ |
 |
|---|
| LysN LTQ |
 |
|---|
| TryLysC LTQ |
 |
|---|
| Try MSlow |
 |
|---|
| ChTry MSlow |
 |
|---|
| ArgC MSlow |
 |
|---|
| LysN MSlow |
 |
|---|
| TryLysC MSlow |
 |
|---|
| Try MShigh |
 |
|---|
| ChTry MShigh |
 |
|---|
| ArgC MShigh |
 |
|---|
| LysN MShigh |
 |
|---|
| TryLysC MShigh |
 |
|---|
General Statistics
Number of major isoforms |
Number of additional isoforms |
Number of all proteins |
Number of amino acids |
Min. Seq. Length |
Max. Seq. Length |
Avg. Seq. Length |
Avg. Mol. Weight |
|---|---|---|---|---|---|---|---|
0 |
457019 |
39 |
1435 |
271.4 |
30.55 |
Amino acid frequency
Ala |
Cys |
Asp |
Glu |
Phe |
Gly |
His |
Ile |
Lys |
Leu |
|---|---|---|---|---|---|---|---|---|---|
7.388 ± 0.056 | 0.608 ± 0.015 |
5.99 ± 0.064 | 5.675 ± 0.057 |
4.38 ± 0.053 | 6.338 ± 0.061 |
2.167 ± 0.029 | 7.484 ± 0.063 |
8.108 ± 0.067 | 9.504 ± 0.074 |
Met |
Asn |
Gln |
Pro |
Arg |
Ser |
Thr |
Val |
Trp |
Tyr |
|---|---|---|---|---|---|---|---|---|---|
2.725 ± 0.03 | 5.288 ± 0.05 |
3.444 ± 0.035 | 4.082 ± 0.039 |
3.992 ± 0.046 | 5.88 ± 0.052 |
5.517 ± 0.044 | 6.639 ± 0.054 |
0.995 ± 0.022 | 3.796 ± 0.038 |
Most of the basic statistics you can see at this page can be downloaded from this CSV file
Proteome-pI is available under Creative Commons Attribution-NoDerivs license, for more details see here
| Reference: Kozlowski LP. Proteome-pI 2.0: Proteome Isoelectric Point Database Update. Nucleic Acids Res. 2021, doi: 10.1093/nar/gkab944 | Contact: Lukasz P. Kozlowski |
