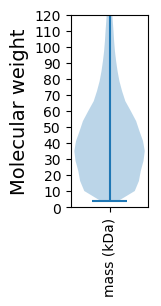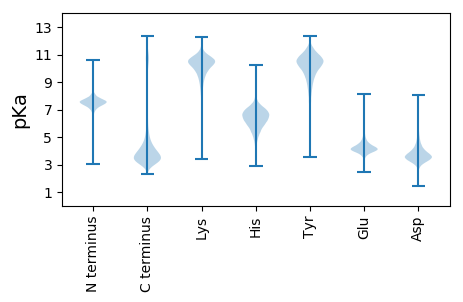
Aquilegia coerulea (Rocky mountain columbine)
Taxonomy: cellular organisms; Eukaryota; Viridiplantae; Streptophyta; Streptophytina; Embryophyta; Tracheophyta; Euphyllophyta; Spermatophyta; Magnoliopsida; Mesangiospermae; Ranunculales; Ranunculaceae; Thalictroideae; Aquilegia
Average proteome isoelectric point is 6.68
Get precalculated fractions of proteins

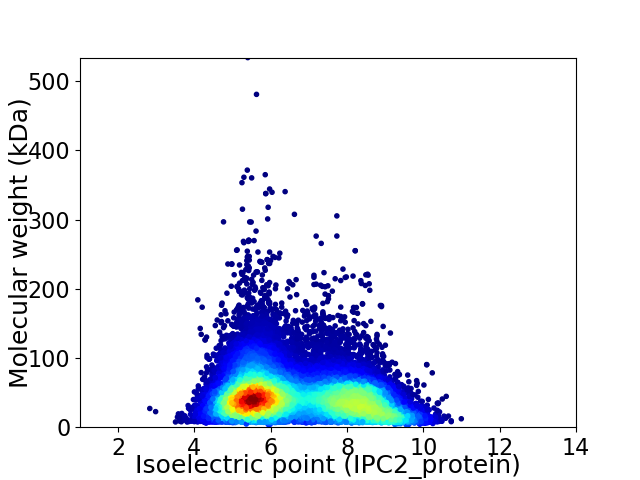
Virtual 2D-PAGE plot for 37018 proteins (isoelectric point calculated using IPC2_protein)
Get csv file with sequences according to given criteria:
* You can choose from 21 different methods for calculating isoelectric point
Summary statistics related to proteome-wise predictions


Protein with the lowest isoelectric point:
>tr|A0A2G5FB02|A0A2G5FB02_AQUCA Uncharacterized protein OS=Aquilegia coerulea OX=218851 GN=AQUCO_00100556v1 PE=4 SV=1
MM1 pKa = 7.57SKK3 pKa = 10.21KK4 pKa = 8.31QTEE7 pKa = 4.27KK8 pKa = 11.08YY9 pKa = 9.88IFRR12 pKa = 11.84DD13 pKa = 3.26EE14 pKa = 4.46CDD16 pKa = 2.91YY17 pKa = 11.43DD18 pKa = 4.44YY19 pKa = 11.64YY20 pKa = 11.55FKK22 pKa = 11.07FSDD25 pKa = 3.98DD26 pKa = 4.3DD27 pKa = 4.41FYY29 pKa = 11.65STNEE33 pKa = 3.84LPIKK37 pKa = 10.34EE38 pKa = 4.24EE39 pKa = 3.95TIEE42 pKa = 4.04AVMNLLEE49 pKa = 5.24KK50 pKa = 10.44EE51 pKa = 4.29LNDD54 pKa = 4.19VRR56 pKa = 11.84NASIKK61 pKa = 10.07MKK63 pKa = 7.72EE64 pKa = 4.2TCDD67 pKa = 3.24VTFSNEE73 pKa = 3.56SSTVMASFDD82 pKa = 4.41LNGLFNISYY91 pKa = 10.28LNDD94 pKa = 3.41SFPFQSVFYY103 pKa = 9.39TSSTSLPPPPPPPLPFTQLAKK124 pKa = 10.75SQLSWCSSVNNNNNQLCEE142 pKa = 4.04FEE144 pKa = 4.71ICSSSNVDD152 pKa = 3.6LVNGTEE158 pKa = 4.0QEE160 pKa = 4.2EE161 pKa = 4.47EE162 pKa = 4.14QVSGSDD168 pKa = 3.5EE169 pKa = 4.42TNGGCEE175 pKa = 3.84EE176 pKa = 4.57HH177 pKa = 6.92VVSTTDD183 pKa = 3.45LNEE186 pKa = 4.44DD187 pKa = 2.81EE188 pKa = 5.09WMDD191 pKa = 5.01LLTLDD196 pKa = 4.86GFSFDD201 pKa = 4.07LL202 pKa = 4.66
MM1 pKa = 7.57SKK3 pKa = 10.21KK4 pKa = 8.31QTEE7 pKa = 4.27KK8 pKa = 11.08YY9 pKa = 9.88IFRR12 pKa = 11.84DD13 pKa = 3.26EE14 pKa = 4.46CDD16 pKa = 2.91YY17 pKa = 11.43DD18 pKa = 4.44YY19 pKa = 11.64YY20 pKa = 11.55FKK22 pKa = 11.07FSDD25 pKa = 3.98DD26 pKa = 4.3DD27 pKa = 4.41FYY29 pKa = 11.65STNEE33 pKa = 3.84LPIKK37 pKa = 10.34EE38 pKa = 4.24EE39 pKa = 3.95TIEE42 pKa = 4.04AVMNLLEE49 pKa = 5.24KK50 pKa = 10.44EE51 pKa = 4.29LNDD54 pKa = 4.19VRR56 pKa = 11.84NASIKK61 pKa = 10.07MKK63 pKa = 7.72EE64 pKa = 4.2TCDD67 pKa = 3.24VTFSNEE73 pKa = 3.56SSTVMASFDD82 pKa = 4.41LNGLFNISYY91 pKa = 10.28LNDD94 pKa = 3.41SFPFQSVFYY103 pKa = 9.39TSSTSLPPPPPPPLPFTQLAKK124 pKa = 10.75SQLSWCSSVNNNNNQLCEE142 pKa = 4.04FEE144 pKa = 4.71ICSSSNVDD152 pKa = 3.6LVNGTEE158 pKa = 4.0QEE160 pKa = 4.2EE161 pKa = 4.47EE162 pKa = 4.14QVSGSDD168 pKa = 3.5EE169 pKa = 4.42TNGGCEE175 pKa = 3.84EE176 pKa = 4.57HH177 pKa = 6.92VVSTTDD183 pKa = 3.45LNEE186 pKa = 4.44DD187 pKa = 2.81EE188 pKa = 5.09WMDD191 pKa = 5.01LLTLDD196 pKa = 4.86GFSFDD201 pKa = 4.07LL202 pKa = 4.66
Molecular weight: 22.97 kDa
Isoelectric point according different methods:
Protein with the highest isoelectric point:
>tr|A0A2G5EHG7|A0A2G5EHG7_AQUCA Protein kinase domain-containing protein OS=Aquilegia coerulea OX=218851 GN=AQUCO_00800146v1 PE=3 SV=1
MM1 pKa = 7.52AGARR5 pKa = 11.84RR6 pKa = 11.84STMMININGGSGNRR20 pKa = 11.84QRR22 pKa = 11.84LSSSRR27 pKa = 11.84LIPKK31 pKa = 9.91RR32 pKa = 11.84GQVKK36 pKa = 10.23AGIAIGLAHH45 pKa = 6.87SLSAIFSLNNNNNRR59 pKa = 11.84RR60 pKa = 11.84SSGSNLLAKK69 pKa = 10.09PSRR72 pKa = 11.84TIQQ75 pKa = 3.1
MM1 pKa = 7.52AGARR5 pKa = 11.84RR6 pKa = 11.84STMMININGGSGNRR20 pKa = 11.84QRR22 pKa = 11.84LSSSRR27 pKa = 11.84LIPKK31 pKa = 9.91RR32 pKa = 11.84GQVKK36 pKa = 10.23AGIAIGLAHH45 pKa = 6.87SLSAIFSLNNNNNRR59 pKa = 11.84RR60 pKa = 11.84SSGSNLLAKK69 pKa = 10.09PSRR72 pKa = 11.84TIQQ75 pKa = 3.1
Molecular weight: 7.98 kDa
Isoelectric point according different methods:
Peptides (in silico digests for buttom-up proteomics)
Below you can find in silico digests of the whole proteome with Trypsin, Chymotrypsin, Trypsin+LysC, LysN, ArgC proteases suitable for different mass spec machines.| Try ESI |
 |
|---|
| ChTry ESI |
 |
|---|
| ArgC ESI |
 |
|---|
| LysN ESI |
 |
|---|
| TryLysC ESI |
 |
|---|
| Try MALDI |
 |
|---|
| ChTry MALDI |
 |
|---|
| ArgC MALDI |
 |
|---|
| LysN MALDI |
 |
|---|
| TryLysC MALDI |
 |
|---|
| Try LTQ |
 |
|---|
| ChTry LTQ |
 |
|---|
| ArgC LTQ |
 |
|---|
| LysN LTQ |
 |
|---|
| TryLysC LTQ |
 |
|---|
| Try MSlow |
 |
|---|
| ChTry MSlow |
 |
|---|
| ArgC MSlow |
 |
|---|
| LysN MSlow |
 |
|---|
| TryLysC MSlow |
 |
|---|
| Try MShigh |
 |
|---|
| ChTry MShigh |
 |
|---|
| ArgC MShigh |
 |
|---|
| LysN MShigh |
 |
|---|
| TryLysC MShigh |
 |
|---|
General Statistics
Number of major isoforms |
Number of additional isoforms |
Number of all proteins |
Number of amino acids |
Min. Seq. Length |
Max. Seq. Length |
Avg. Seq. Length |
Avg. Mol. Weight |
|---|---|---|---|---|---|---|---|
15996891 |
33 |
5451 |
432.1 |
48.35 |
Amino acid frequency
Ala |
Cys |
Asp |
Glu |
Phe |
Gly |
His |
Ile |
Lys |
Leu |
|---|---|---|---|---|---|---|---|---|---|
6.251 ± 0.012 | 1.861 ± 0.006 |
5.32 ± 0.008 | 6.471 ± 0.012 |
4.254 ± 0.01 | 6.434 ± 0.013 |
2.385 ± 0.006 | 5.635 ± 0.01 |
6.212 ± 0.013 | 9.754 ± 0.014 |
Met |
Asn |
Gln |
Pro |
Arg |
Ser |
Thr |
Val |
Trp |
Tyr |
|---|---|---|---|---|---|---|---|---|---|
2.459 ± 0.005 | 4.59 ± 0.007 |
4.682 ± 0.012 | 3.77 ± 0.01 |
5.104 ± 0.009 | 8.972 ± 0.015 |
5.055 ± 0.006 | 6.594 ± 0.009 |
1.267 ± 0.005 | 2.931 ± 0.006 |
Most of the basic statistics you can see at this page can be downloaded from this CSV file
Proteome-pI is available under Creative Commons Attribution-NoDerivs license, for more details see here
| Reference: Kozlowski LP. Proteome-pI 2.0: Proteome Isoelectric Point Database Update. Nucleic Acids Res. 2021, doi: 10.1093/nar/gkab944 | Contact: Lukasz P. Kozlowski |
