Vibrio rumoiensis 1S-45
Taxonomy: cellular organisms; Bacteria; Proteobacteria; Gammaproteobacteria; Vibrionales; Vibrionaceae; Vibrio; Vibrio rumoiensis
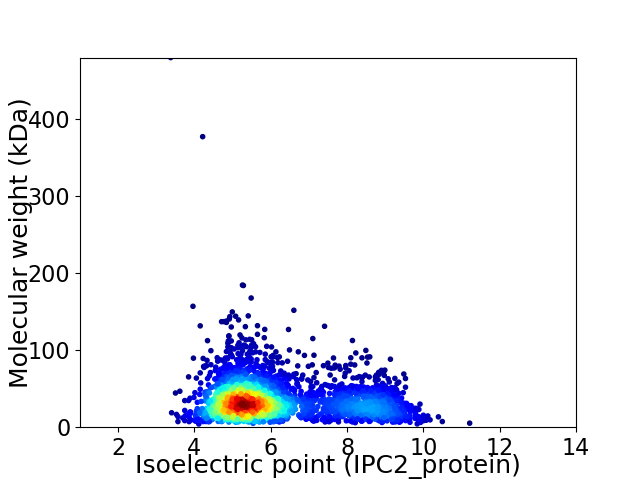
Average proteome isoelectric point is 6.12
Get precalculated fractions of proteins

Virtual 2D-PAGE plot for 2981 proteins (isoelectric point calculated using IPC2_protein)
Get csv file with sequences according to given criteria:
* You can choose from 21 different methods for calculating isoelectric point
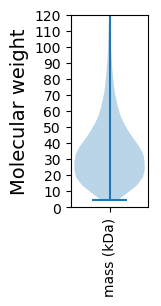
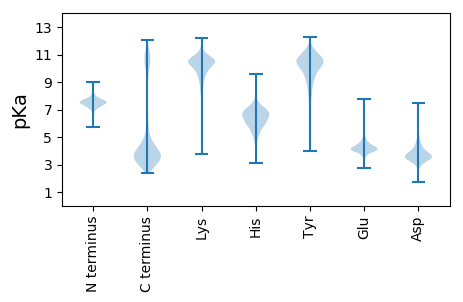
Summary statistics related to proteome-wise predictions


Protein with the lowest isoelectric point:
>tr|A0A1E5E189|A0A1E5E189_9VIBR Flavodoxin OS=Vibrio rumoiensis 1S-45 OX=1188252 GN=A1QC_02380 PE=3 SV=1
MM1 pKa = 7.65KK2 pKa = 9.08KK3 pKa = 8.28TLLALAVSTIAFAGSVNAAEE23 pKa = 5.33LYY25 pKa = 10.92SSDD28 pKa = 3.42TTSVKK33 pKa = 10.68LSGEE37 pKa = 3.58VDD39 pKa = 3.54TYY41 pKa = 11.76LKK43 pKa = 10.29TGDD46 pKa = 4.51LKK48 pKa = 11.52FEE50 pKa = 4.34GQPKK54 pKa = 10.33DD55 pKa = 3.66KK56 pKa = 10.66SDD58 pKa = 3.62PNAAIWAKK66 pKa = 8.0TQFDD70 pKa = 3.74VDD72 pKa = 4.01YY73 pKa = 10.82KK74 pKa = 10.93ISTNNTAFLSFEE86 pKa = 4.2VEE88 pKa = 3.97GDD90 pKa = 3.11GDD92 pKa = 3.87AGAKK96 pKa = 9.96FDD98 pKa = 4.59DD99 pKa = 4.75VYY101 pKa = 11.78AGFTNNTFGTFTIGEE116 pKa = 4.37AGDD119 pKa = 3.89SFDD122 pKa = 5.31ALEE125 pKa = 4.64KK126 pKa = 10.43TDD128 pKa = 3.41ITNEE132 pKa = 4.07GIYY135 pKa = 10.46AGTIEE140 pKa = 5.76SEE142 pKa = 4.32DD143 pKa = 3.32SSNAIRR149 pKa = 11.84WQKK152 pKa = 11.14AFGGLALSADD162 pKa = 3.8AQTNTDD168 pKa = 3.17SDD170 pKa = 4.59DD171 pKa = 3.59NVYY174 pKa = 10.95ALSGDD179 pKa = 3.44WTITDD184 pKa = 3.99AFSVGAGYY192 pKa = 7.95ATSGSDD198 pKa = 3.47AYY200 pKa = 8.22TTALSASAQFGDD212 pKa = 4.61LYY214 pKa = 11.04LAASASQYY222 pKa = 11.41KK223 pKa = 10.47NFGGDD228 pKa = 3.46FEE230 pKa = 4.8FTGEE234 pKa = 4.13TEE236 pKa = 3.75KK237 pKa = 10.67TFNVDD242 pKa = 2.39ITEE245 pKa = 4.32GNTYY249 pKa = 10.48GIAAAYY255 pKa = 9.23QMNEE259 pKa = 3.23TRR261 pKa = 11.84FYY263 pKa = 11.32GSYY266 pKa = 11.21ALVDD270 pKa = 4.36DD271 pKa = 4.57DD272 pKa = 5.1TDD274 pKa = 3.79VKK276 pKa = 10.93FNAYY280 pKa = 8.07TVGIDD285 pKa = 3.71HH286 pKa = 7.26SIIDD290 pKa = 3.7NVLVFVEE297 pKa = 4.37YY298 pKa = 10.34TGVTGDD304 pKa = 4.02DD305 pKa = 3.42TTGNDD310 pKa = 3.42TTGNLYY316 pKa = 9.79MLGAYY321 pKa = 7.66LTFF324 pKa = 4.85
MM1 pKa = 7.65KK2 pKa = 9.08KK3 pKa = 8.28TLLALAVSTIAFAGSVNAAEE23 pKa = 5.33LYY25 pKa = 10.92SSDD28 pKa = 3.42TTSVKK33 pKa = 10.68LSGEE37 pKa = 3.58VDD39 pKa = 3.54TYY41 pKa = 11.76LKK43 pKa = 10.29TGDD46 pKa = 4.51LKK48 pKa = 11.52FEE50 pKa = 4.34GQPKK54 pKa = 10.33DD55 pKa = 3.66KK56 pKa = 10.66SDD58 pKa = 3.62PNAAIWAKK66 pKa = 8.0TQFDD70 pKa = 3.74VDD72 pKa = 4.01YY73 pKa = 10.82KK74 pKa = 10.93ISTNNTAFLSFEE86 pKa = 4.2VEE88 pKa = 3.97GDD90 pKa = 3.11GDD92 pKa = 3.87AGAKK96 pKa = 9.96FDD98 pKa = 4.59DD99 pKa = 4.75VYY101 pKa = 11.78AGFTNNTFGTFTIGEE116 pKa = 4.37AGDD119 pKa = 3.89SFDD122 pKa = 5.31ALEE125 pKa = 4.64KK126 pKa = 10.43TDD128 pKa = 3.41ITNEE132 pKa = 4.07GIYY135 pKa = 10.46AGTIEE140 pKa = 5.76SEE142 pKa = 4.32DD143 pKa = 3.32SSNAIRR149 pKa = 11.84WQKK152 pKa = 11.14AFGGLALSADD162 pKa = 3.8AQTNTDD168 pKa = 3.17SDD170 pKa = 4.59DD171 pKa = 3.59NVYY174 pKa = 10.95ALSGDD179 pKa = 3.44WTITDD184 pKa = 3.99AFSVGAGYY192 pKa = 7.95ATSGSDD198 pKa = 3.47AYY200 pKa = 8.22TTALSASAQFGDD212 pKa = 4.61LYY214 pKa = 11.04LAASASQYY222 pKa = 11.41KK223 pKa = 10.47NFGGDD228 pKa = 3.46FEE230 pKa = 4.8FTGEE234 pKa = 4.13TEE236 pKa = 3.75KK237 pKa = 10.67TFNVDD242 pKa = 2.39ITEE245 pKa = 4.32GNTYY249 pKa = 10.48GIAAAYY255 pKa = 9.23QMNEE259 pKa = 3.23TRR261 pKa = 11.84FYY263 pKa = 11.32GSYY266 pKa = 11.21ALVDD270 pKa = 4.36DD271 pKa = 4.57DD272 pKa = 5.1TDD274 pKa = 3.79VKK276 pKa = 10.93FNAYY280 pKa = 8.07TVGIDD285 pKa = 3.71HH286 pKa = 7.26SIIDD290 pKa = 3.7NVLVFVEE297 pKa = 4.37YY298 pKa = 10.34TGVTGDD304 pKa = 4.02DD305 pKa = 3.42TTGNDD310 pKa = 3.42TTGNLYY316 pKa = 9.79MLGAYY321 pKa = 7.66LTFF324 pKa = 4.85
Molecular weight: 34.57 kDa
Isoelectric point according different methods:
Protein with the highest isoelectric point:
>tr|A0A1E5E338|A0A1E5E338_9VIBR Methylated-DNA--protein-cysteine methyltransferase OS=Vibrio rumoiensis 1S-45 OX=1188252 GN=A1QC_08280 PE=3 SV=1
MM1 pKa = 7.45KK2 pKa = 9.5RR3 pKa = 11.84TFQPTVLKK11 pKa = 10.46RR12 pKa = 11.84KK13 pKa = 7.65RR14 pKa = 11.84THH16 pKa = 5.89GFRR19 pKa = 11.84ARR21 pKa = 11.84MATKK25 pKa = 10.46NGRR28 pKa = 11.84KK29 pKa = 7.78TINARR34 pKa = 11.84RR35 pKa = 11.84AKK37 pKa = 9.74GRR39 pKa = 11.84KK40 pKa = 8.91RR41 pKa = 11.84LSKK44 pKa = 10.84
MM1 pKa = 7.45KK2 pKa = 9.5RR3 pKa = 11.84TFQPTVLKK11 pKa = 10.46RR12 pKa = 11.84KK13 pKa = 7.65RR14 pKa = 11.84THH16 pKa = 5.89GFRR19 pKa = 11.84ARR21 pKa = 11.84MATKK25 pKa = 10.46NGRR28 pKa = 11.84KK29 pKa = 7.78TINARR34 pKa = 11.84RR35 pKa = 11.84AKK37 pKa = 9.74GRR39 pKa = 11.84KK40 pKa = 8.91RR41 pKa = 11.84LSKK44 pKa = 10.84
Molecular weight: 5.24 kDa
Isoelectric point according different methods:
Peptides (in silico digests for buttom-up proteomics)
Below you can find in silico digests of the whole proteome with Trypsin, Chymotrypsin, Trypsin+LysC, LysN, ArgC proteases suitable for different mass spec machines.| Try ESI |
 |
|---|
| ChTry ESI |
 |
|---|
| ArgC ESI |
 |
|---|
| LysN ESI |
 |
|---|
| TryLysC ESI |
 |
|---|
| Try MALDI |
 |
|---|
| ChTry MALDI |
 |
|---|
| ArgC MALDI |
 |
|---|
| LysN MALDI |
 |
|---|
| TryLysC MALDI |
 |
|---|
| Try LTQ |
 |
|---|
| ChTry LTQ |
 |
|---|
| ArgC LTQ |
 |
|---|
| LysN LTQ |
 |
|---|
| TryLysC LTQ |
 |
|---|
| Try MSlow |
 |
|---|
| ChTry MSlow |
 |
|---|
| ArgC MSlow |
 |
|---|
| LysN MSlow |
 |
|---|
| TryLysC MSlow |
 |
|---|
| Try MShigh |
 |
|---|
| ChTry MShigh |
 |
|---|
| ArgC MShigh |
 |
|---|
| LysN MShigh |
 |
|---|
| TryLysC MShigh |
 |
|---|
General Statistics
Number of major isoforms |
Number of additional isoforms |
Number of all proteins |
Number of amino acids |
Min. Seq. Length |
Max. Seq. Length |
Avg. Seq. Length |
Avg. Mol. Weight |
|---|---|---|---|---|---|---|---|
0 |
974289 |
35 |
4532 |
326.8 |
36.34 |
Amino acid frequency
Ala |
Cys |
Asp |
Glu |
Phe |
Gly |
His |
Ile |
Lys |
Leu |
|---|---|---|---|---|---|---|---|---|---|
8.258 ± 0.049 | 1.049 ± 0.016 |
5.591 ± 0.054 | 6.007 ± 0.048 |
4.207 ± 0.035 | 6.824 ± 0.045 |
2.309 ± 0.024 | 6.737 ± 0.039 |
5.517 ± 0.04 | 10.228 ± 0.059 |
Met |
Asn |
Gln |
Pro |
Arg |
Ser |
Thr |
Val |
Trp |
Tyr |
|---|---|---|---|---|---|---|---|---|---|
2.731 ± 0.025 | 4.333 ± 0.033 |
3.965 ± 0.025 | 4.738 ± 0.041 |
4.173 ± 0.039 | 6.636 ± 0.038 |
5.456 ± 0.048 | 6.93 ± 0.037 |
1.279 ± 0.018 | 3.032 ± 0.025 |
Most of the basic statistics you can see at this page can be downloaded from this CSV file
Proteome-pI is available under Creative Commons Attribution-NoDerivs license, for more details see here
| Reference: Kozlowski LP. Proteome-pI 2.0: Proteome Isoelectric Point Database Update. Nucleic Acids Res. 2021, doi: 10.1093/nar/gkab944 | Contact: Lukasz P. Kozlowski |
