Dickeya phage vB_DsoM_JA33
Taxonomy: Viruses; Duplodnaviria; Heunggongvirae; Uroviricota; Caudoviricetes; Caudovirales; Myoviridae; Salmondvirus; unclassified Salmondvirus
Average proteome isoelectric point is 6.45
Get precalculated fractions of proteins

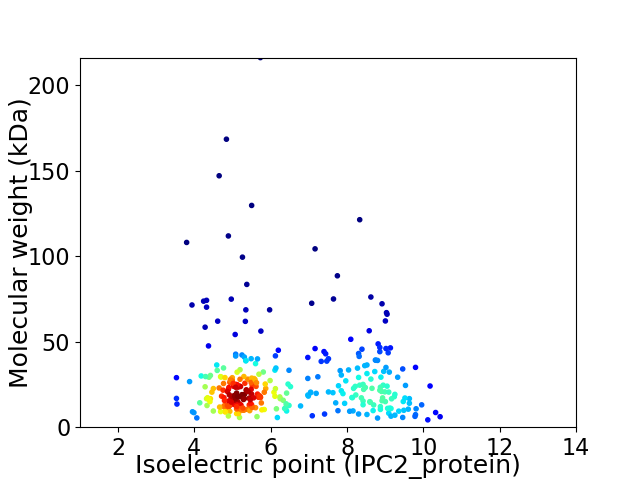
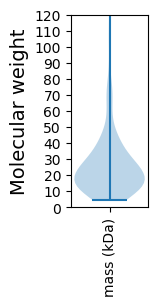
Virtual 2D-PAGE plot for 321 proteins (isoelectric point calculated using IPC2_protein)
Get csv file with sequences according to given criteria:
* You can choose from 21 different methods for calculating isoelectric point
Summary statistics related to proteome-wise predictions


Protein with the lowest isoelectric point:
>tr|A0A384ZZG0|A0A384ZZG0_9CAUD Uncharacterized protein OS=Dickeya phage vB_DsoM_JA33 OX=2283032 GN=JA33_260 PE=4 SV=1
MM1 pKa = 7.61KK2 pKa = 10.76SMTRR6 pKa = 11.84VISILAGTDD15 pKa = 3.36EE16 pKa = 4.65LSEE19 pKa = 4.09AFISVLHH26 pKa = 6.36KK27 pKa = 10.91ADD29 pKa = 2.97VDD31 pKa = 4.28VNVDD35 pKa = 2.84IDD37 pKa = 4.96RR38 pKa = 11.84VILLNDD44 pKa = 3.49YY45 pKa = 11.04GSATLVPNDD54 pKa = 3.38NAVEE58 pKa = 4.1IEE60 pKa = 4.01SSNLHH65 pKa = 5.88GSRR68 pKa = 11.84VIINDD73 pKa = 3.63PVSALLFALYY83 pKa = 10.32RR84 pKa = 11.84LNLRR88 pKa = 11.84LDD90 pKa = 3.76VEE92 pKa = 5.19DD93 pKa = 4.21EE94 pKa = 4.21DD95 pKa = 4.95QIGVLPTGYY104 pKa = 9.38PVLPEE109 pKa = 4.07PRR111 pKa = 11.84CTFADD116 pKa = 4.01HH117 pKa = 6.5SAKK120 pKa = 10.52AYY122 pKa = 9.36TKK124 pKa = 10.44EE125 pKa = 3.95QMLEE129 pKa = 3.93YY130 pKa = 10.79ARR132 pKa = 11.84DD133 pKa = 3.35AVVRR137 pKa = 11.84FTGMAPFEE145 pKa = 4.43IEE147 pKa = 4.0SDD149 pKa = 3.62PVSFDD154 pKa = 4.37DD155 pKa = 4.14MYY157 pKa = 11.41KK158 pKa = 8.93EE159 pKa = 5.25HH160 pKa = 6.96AVEE163 pKa = 4.09WCDD166 pKa = 3.49HH167 pKa = 6.61CGGQIGDD174 pKa = 4.34DD175 pKa = 3.99CSCEE179 pKa = 4.2DD180 pKa = 3.96GEE182 pKa = 4.68ADD184 pKa = 3.61EE185 pKa = 6.6DD186 pKa = 4.05EE187 pKa = 6.05DD188 pKa = 5.68EE189 pKa = 4.99DD190 pKa = 5.4EE191 pKa = 4.28EE192 pKa = 5.43WEE194 pKa = 4.8DD195 pKa = 5.15ADD197 pKa = 5.83CEE199 pKa = 4.53HH200 pKa = 7.14CGCTNCDD207 pKa = 3.22CDD209 pKa = 4.6IDD211 pKa = 4.7EE212 pKa = 5.2DD213 pKa = 4.03EE214 pKa = 5.41CPRR217 pKa = 11.84CHH219 pKa = 7.78SSSCQCLPDD228 pKa = 4.29FDD230 pKa = 4.69GQEE233 pKa = 4.72DD234 pKa = 4.06PDD236 pKa = 3.56QRR238 pKa = 11.84KK239 pKa = 8.93
MM1 pKa = 7.61KK2 pKa = 10.76SMTRR6 pKa = 11.84VISILAGTDD15 pKa = 3.36EE16 pKa = 4.65LSEE19 pKa = 4.09AFISVLHH26 pKa = 6.36KK27 pKa = 10.91ADD29 pKa = 2.97VDD31 pKa = 4.28VNVDD35 pKa = 2.84IDD37 pKa = 4.96RR38 pKa = 11.84VILLNDD44 pKa = 3.49YY45 pKa = 11.04GSATLVPNDD54 pKa = 3.38NAVEE58 pKa = 4.1IEE60 pKa = 4.01SSNLHH65 pKa = 5.88GSRR68 pKa = 11.84VIINDD73 pKa = 3.63PVSALLFALYY83 pKa = 10.32RR84 pKa = 11.84LNLRR88 pKa = 11.84LDD90 pKa = 3.76VEE92 pKa = 5.19DD93 pKa = 4.21EE94 pKa = 4.21DD95 pKa = 4.95QIGVLPTGYY104 pKa = 9.38PVLPEE109 pKa = 4.07PRR111 pKa = 11.84CTFADD116 pKa = 4.01HH117 pKa = 6.5SAKK120 pKa = 10.52AYY122 pKa = 9.36TKK124 pKa = 10.44EE125 pKa = 3.95QMLEE129 pKa = 3.93YY130 pKa = 10.79ARR132 pKa = 11.84DD133 pKa = 3.35AVVRR137 pKa = 11.84FTGMAPFEE145 pKa = 4.43IEE147 pKa = 4.0SDD149 pKa = 3.62PVSFDD154 pKa = 4.37DD155 pKa = 4.14MYY157 pKa = 11.41KK158 pKa = 8.93EE159 pKa = 5.25HH160 pKa = 6.96AVEE163 pKa = 4.09WCDD166 pKa = 3.49HH167 pKa = 6.61CGGQIGDD174 pKa = 4.34DD175 pKa = 3.99CSCEE179 pKa = 4.2DD180 pKa = 3.96GEE182 pKa = 4.68ADD184 pKa = 3.61EE185 pKa = 6.6DD186 pKa = 4.05EE187 pKa = 6.05DD188 pKa = 5.68EE189 pKa = 4.99DD190 pKa = 5.4EE191 pKa = 4.28EE192 pKa = 5.43WEE194 pKa = 4.8DD195 pKa = 5.15ADD197 pKa = 5.83CEE199 pKa = 4.53HH200 pKa = 7.14CGCTNCDD207 pKa = 3.22CDD209 pKa = 4.6IDD211 pKa = 4.7EE212 pKa = 5.2DD213 pKa = 4.03EE214 pKa = 5.41CPRR217 pKa = 11.84CHH219 pKa = 7.78SSSCQCLPDD228 pKa = 4.29FDD230 pKa = 4.69GQEE233 pKa = 4.72DD234 pKa = 4.06PDD236 pKa = 3.56QRR238 pKa = 11.84KK239 pKa = 8.93
Molecular weight: 26.67 kDa
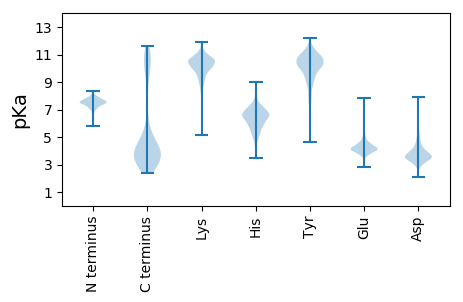
Isoelectric point according different methods:
Protein with the highest isoelectric point:
>tr|A0A384ZZF4|A0A384ZZF4_9CAUD Uncharacterized protein OS=Dickeya phage vB_DsoM_JA33 OX=2283032 GN=JA33_213 PE=4 SV=1
MM1 pKa = 7.9KK2 pKa = 10.06FRR4 pKa = 11.84KK5 pKa = 9.79LLTRR9 pKa = 11.84NKK11 pKa = 9.64NRR13 pKa = 11.84RR14 pKa = 11.84SISASCFIGRR24 pKa = 11.84LFFEE28 pKa = 4.44IGVGRR33 pKa = 11.84EE34 pKa = 3.36LWYY37 pKa = 8.43FTRR40 pKa = 11.84FGKK43 pKa = 10.53NNDD46 pKa = 2.75HH47 pKa = 7.27RR48 pKa = 11.84IYY50 pKa = 10.7HH51 pKa = 6.52LFHH54 pKa = 7.53VGVTRR59 pKa = 11.84LVNPSGEE66 pKa = 3.89AHH68 pKa = 6.47TDD70 pKa = 3.16VLVISFLLLNIKK82 pKa = 9.42FGWMTIKK89 pKa = 10.81DD90 pKa = 3.66KK91 pKa = 11.52
MM1 pKa = 7.9KK2 pKa = 10.06FRR4 pKa = 11.84KK5 pKa = 9.79LLTRR9 pKa = 11.84NKK11 pKa = 9.64NRR13 pKa = 11.84RR14 pKa = 11.84SISASCFIGRR24 pKa = 11.84LFFEE28 pKa = 4.44IGVGRR33 pKa = 11.84EE34 pKa = 3.36LWYY37 pKa = 8.43FTRR40 pKa = 11.84FGKK43 pKa = 10.53NNDD46 pKa = 2.75HH47 pKa = 7.27RR48 pKa = 11.84IYY50 pKa = 10.7HH51 pKa = 6.52LFHH54 pKa = 7.53VGVTRR59 pKa = 11.84LVNPSGEE66 pKa = 3.89AHH68 pKa = 6.47TDD70 pKa = 3.16VLVISFLLLNIKK82 pKa = 9.42FGWMTIKK89 pKa = 10.81DD90 pKa = 3.66KK91 pKa = 11.52
Molecular weight: 10.77 kDa
Isoelectric point according different methods:
Peptides (in silico digests for buttom-up proteomics)
Below you can find in silico digests of the whole proteome with Trypsin, Chymotrypsin, Trypsin+LysC, LysN, ArgC proteases suitable for different mass spec machines.| Try ESI |
 |
|---|
| ChTry ESI |
 |
|---|
| ArgC ESI |
 |
|---|
| LysN ESI |
 |
|---|
| TryLysC ESI |
 |
|---|
| Try MALDI |
 |
|---|
| ChTry MALDI |
 |
|---|
| ArgC MALDI |
 |
|---|
| LysN MALDI |
 |
|---|
| TryLysC MALDI |
 |
|---|
| Try LTQ |
 |
|---|
| ChTry LTQ |
 |
|---|
| ArgC LTQ |
 |
|---|
| LysN LTQ |
 |
|---|
| TryLysC LTQ |
 |
|---|
| Try MSlow |
 |
|---|
| ChTry MSlow |
 |
|---|
| ArgC MSlow |
 |
|---|
| LysN MSlow |
 |
|---|
| TryLysC MSlow |
 |
|---|
| Try MShigh |
 |
|---|
| ChTry MShigh |
 |
|---|
| ArgC MShigh |
 |
|---|
| LysN MShigh |
 |
|---|
| TryLysC MShigh |
 |
|---|
General Statistics
Number of major isoforms |
Number of additional isoforms |
Number of all proteins |
Number of amino acids |
Min. Seq. Length |
Max. Seq. Length |
Avg. Seq. Length |
Avg. Mol. Weight |
|---|---|---|---|---|---|---|---|
0 |
79750 |
33 |
1944 |
248.4 |
27.92 |
Amino acid frequency
Ala |
Cys |
Asp |
Glu |
Phe |
Gly |
His |
Ile |
Lys |
Leu |
|---|---|---|---|---|---|---|---|---|---|
7.619 ± 0.148 | 1.105 ± 0.063 |
6.588 ± 0.145 | 6.83 ± 0.249 |
4.324 ± 0.082 | 5.949 ± 0.154 |
1.832 ± 0.069 | 6.13 ± 0.123 |
6.884 ± 0.216 | 8.221 ± 0.148 |
Met |
Asn |
Gln |
Pro |
Arg |
Ser |
Thr |
Val |
Trp |
Tyr |
|---|---|---|---|---|---|---|---|---|---|
2.493 ± 0.072 | 4.816 ± 0.103 |
4.217 ± 0.107 | 3.387 ± 0.074 |
5.32 ± 0.114 | 6.961 ± 0.11 |
5.797 ± 0.146 | 6.959 ± 0.109 |
1.05 ± 0.049 | 3.52 ± 0.121 |
Most of the basic statistics you can see at this page can be downloaded from this CSV file
Proteome-pI is available under Creative Commons Attribution-NoDerivs license, for more details see here
| Reference: Kozlowski LP. Proteome-pI 2.0: Proteome Isoelectric Point Database Update. Nucleic Acids Res. 2021, doi: 10.1093/nar/gkab944 | Contact: Lukasz P. Kozlowski |
