Gordonia phage Guacamole
Taxonomy: Viruses; Duplodnaviria; Heunggongvirae; Uroviricota; Caudoviricetes; Caudovirales; Siphoviridae; Fairfaxidumvirus; unclassified Fairfaxidumvirus
Average proteome isoelectric point is 6.17
Get precalculated fractions of proteins

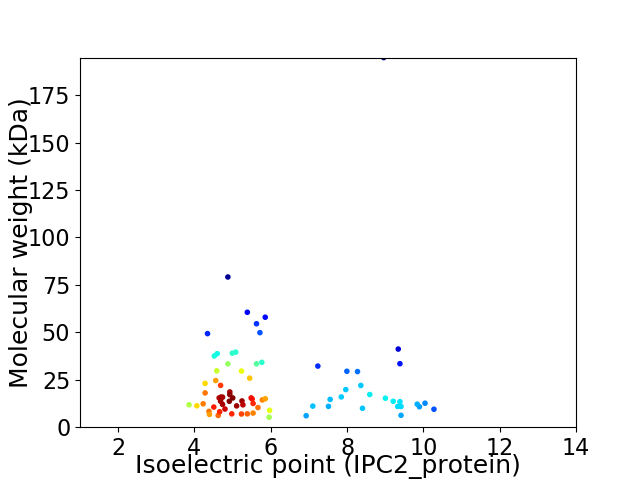
Virtual 2D-PAGE plot for 78 proteins (isoelectric point calculated using IPC2_protein)
Get csv file with sequences according to given criteria:
* You can choose from 21 different methods for calculating isoelectric point
Summary statistics related to proteome-wise predictions


Protein with the lowest isoelectric point:
>tr|A0A142KBN8|A0A142KBN8_9CAUD Minor tail protein OS=Gordonia phage Guacamole OX=1821553 GN=30 PE=4 SV=1
MM1 pKa = 7.46ANDD4 pKa = 4.61TIFEE8 pKa = 4.28LPEE11 pKa = 4.65IPGVTFTASYY21 pKa = 10.85GSGGEE26 pKa = 4.14SGLPSNWIRR35 pKa = 11.84IVGTVEE41 pKa = 3.86NPWYY45 pKa = 10.31DD46 pKa = 3.26PTYY49 pKa = 11.17NYY51 pKa = 11.17GLDD54 pKa = 4.0PNGHH58 pKa = 5.86TEE60 pKa = 4.02MTDD63 pKa = 2.45PWKK66 pKa = 10.7RR67 pKa = 11.84HH68 pKa = 3.99TEE70 pKa = 4.05FPEE73 pKa = 4.17VCSMGFGGPSIGLPTDD89 pKa = 3.96PPPPPVEE96 pKa = 4.3PEE98 pKa = 3.82PTPDD102 pKa = 4.39LEE104 pKa = 4.41EE105 pKa = 4.43PTDD108 pKa = 3.7GG109 pKa = 4.88
MM1 pKa = 7.46ANDD4 pKa = 4.61TIFEE8 pKa = 4.28LPEE11 pKa = 4.65IPGVTFTASYY21 pKa = 10.85GSGGEE26 pKa = 4.14SGLPSNWIRR35 pKa = 11.84IVGTVEE41 pKa = 3.86NPWYY45 pKa = 10.31DD46 pKa = 3.26PTYY49 pKa = 11.17NYY51 pKa = 11.17GLDD54 pKa = 4.0PNGHH58 pKa = 5.86TEE60 pKa = 4.02MTDD63 pKa = 2.45PWKK66 pKa = 10.7RR67 pKa = 11.84HH68 pKa = 3.99TEE70 pKa = 4.05FPEE73 pKa = 4.17VCSMGFGGPSIGLPTDD89 pKa = 3.96PPPPPVEE96 pKa = 4.3PEE98 pKa = 3.82PTPDD102 pKa = 4.39LEE104 pKa = 4.41EE105 pKa = 4.43PTDD108 pKa = 3.7GG109 pKa = 4.88
Molecular weight: 11.82 kDa
Isoelectric point according different methods:
Protein with the highest isoelectric point:
>tr|A0A142KBT6|A0A142KBT6_9CAUD HNH endonuclease OS=Gordonia phage Guacamole OX=1821553 GN=78 PE=4 SV=1
MM1 pKa = 7.57ARR3 pKa = 11.84RR4 pKa = 11.84RR5 pKa = 11.84PNPEE9 pKa = 3.24QRR11 pKa = 11.84GLGHH15 pKa = 6.69AHH17 pKa = 6.24KK18 pKa = 10.55QQVKK22 pKa = 9.27HH23 pKa = 5.94LKK25 pKa = 7.95TRR27 pKa = 11.84HH28 pKa = 5.47VDD30 pKa = 3.6GTPCWWCGKK39 pKa = 9.42PMYY42 pKa = 10.3LDD44 pKa = 3.19RR45 pKa = 11.84TRR47 pKa = 11.84NPDD50 pKa = 3.69YY51 pKa = 11.07NPTSPDD57 pKa = 3.55PASGSLAGDD66 pKa = 3.23HH67 pKa = 6.01TLARR71 pKa = 11.84THH73 pKa = 6.66GGTLADD79 pKa = 3.84RR80 pKa = 11.84LLHH83 pKa = 5.94GRR85 pKa = 11.84CNKK88 pKa = 9.38QRR90 pKa = 11.84GDD92 pKa = 3.25GRR94 pKa = 11.84HH95 pKa = 5.79DD96 pKa = 3.32HH97 pKa = 6.33TRR99 pKa = 11.84PALTGKK105 pKa = 8.91HH106 pKa = 4.65QPAPTTHH113 pKa = 7.03LAINCWPP120 pKa = 3.68
MM1 pKa = 7.57ARR3 pKa = 11.84RR4 pKa = 11.84RR5 pKa = 11.84PNPEE9 pKa = 3.24QRR11 pKa = 11.84GLGHH15 pKa = 6.69AHH17 pKa = 6.24KK18 pKa = 10.55QQVKK22 pKa = 9.27HH23 pKa = 5.94LKK25 pKa = 7.95TRR27 pKa = 11.84HH28 pKa = 5.47VDD30 pKa = 3.6GTPCWWCGKK39 pKa = 9.42PMYY42 pKa = 10.3LDD44 pKa = 3.19RR45 pKa = 11.84TRR47 pKa = 11.84NPDD50 pKa = 3.69YY51 pKa = 11.07NPTSPDD57 pKa = 3.55PASGSLAGDD66 pKa = 3.23HH67 pKa = 6.01TLARR71 pKa = 11.84THH73 pKa = 6.66GGTLADD79 pKa = 3.84RR80 pKa = 11.84LLHH83 pKa = 5.94GRR85 pKa = 11.84CNKK88 pKa = 9.38QRR90 pKa = 11.84GDD92 pKa = 3.25GRR94 pKa = 11.84HH95 pKa = 5.79DD96 pKa = 3.32HH97 pKa = 6.33TRR99 pKa = 11.84PALTGKK105 pKa = 8.91HH106 pKa = 4.65QPAPTTHH113 pKa = 7.03LAINCWPP120 pKa = 3.68
Molecular weight: 13.45 kDa
Isoelectric point according different methods:
Peptides (in silico digests for buttom-up proteomics)
Below you can find in silico digests of the whole proteome with Trypsin, Chymotrypsin, Trypsin+LysC, LysN, ArgC proteases suitable for different mass spec machines.| Try ESI |
 |
|---|
| ChTry ESI |
 |
|---|
| ArgC ESI |
 |
|---|
| LysN ESI |
 |
|---|
| TryLysC ESI |
 |
|---|
| Try MALDI |
 |
|---|
| ChTry MALDI |
 |
|---|
| ArgC MALDI |
 |
|---|
| LysN MALDI |
 |
|---|
| TryLysC MALDI |
 |
|---|
| Try LTQ |
 |
|---|
| ChTry LTQ |
 |
|---|
| ArgC LTQ |
 |
|---|
| LysN LTQ |
 |
|---|
| TryLysC LTQ |
 |
|---|
| Try MSlow |
 |
|---|
| ChTry MSlow |
 |
|---|
| ArgC MSlow |
 |
|---|
| LysN MSlow |
 |
|---|
| TryLysC MSlow |
 |
|---|
| Try MShigh |
 |
|---|
| ChTry MShigh |
 |
|---|
| ArgC MShigh |
 |
|---|
| LysN MShigh |
 |
|---|
| TryLysC MShigh |
 |
|---|
General Statistics
Number of major isoforms |
Number of additional isoforms |
Number of all proteins |
Number of amino acids |
Min. Seq. Length |
Max. Seq. Length |
Avg. Seq. Length |
Avg. Mol. Weight |
|---|---|---|---|---|---|---|---|
0 |
16205 |
47 |
1840 |
207.8 |
22.67 |
Amino acid frequency
Ala |
Cys |
Asp |
Glu |
Phe |
Gly |
His |
Ile |
Lys |
Leu |
|---|---|---|---|---|---|---|---|---|---|
11.651 ± 0.445 | 0.821 ± 0.141 |
6.955 ± 0.326 | 5.467 ± 0.341 |
2.826 ± 0.135 | 8.374 ± 0.407 |
2.073 ± 0.169 | 4.554 ± 0.162 |
3.314 ± 0.25 | 7.874 ± 0.346 |
Met |
Asn |
Gln |
Pro |
Arg |
Ser |
Thr |
Val |
Trp |
Tyr |
|---|---|---|---|---|---|---|---|---|---|
2.265 ± 0.191 | 2.832 ± 0.137 |
5.924 ± 0.237 | 3.382 ± 0.147 |
7.461 ± 0.358 | 5.227 ± 0.211 |
6.714 ± 0.244 | 7.893 ± 0.237 |
2.129 ± 0.117 | 2.265 ± 0.17 |
Most of the basic statistics you can see at this page can be downloaded from this CSV file
Proteome-pI is available under Creative Commons Attribution-NoDerivs license, for more details see here
| Reference: Kozlowski LP. Proteome-pI 2.0: Proteome Isoelectric Point Database Update. Nucleic Acids Res. 2021, doi: 10.1093/nar/gkab944 | Contact: Lukasz P. Kozlowski |
