Roseospirillum parvum
Taxonomy: cellular organisms; Bacteria; Proteobacteria; Alphaproteobacteria; Rhodospirillales; Rhodospirillaceae; Roseospirillum
Average proteome isoelectric point is 6.36
Get precalculated fractions of proteins

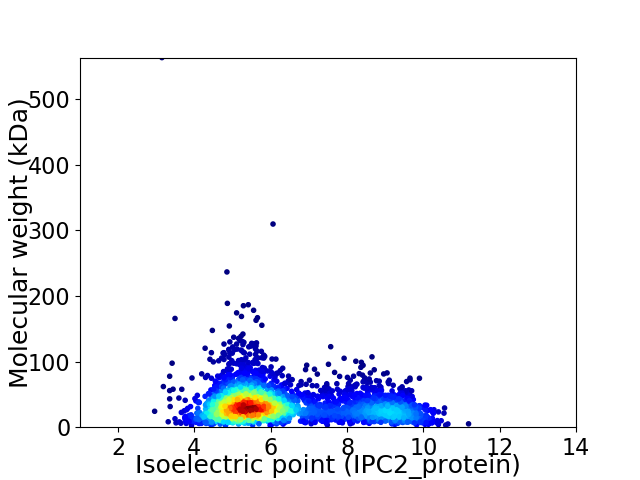
Virtual 2D-PAGE plot for 3067 proteins (isoelectric point calculated using IPC2_protein)
Get csv file with sequences according to given criteria:
* You can choose from 21 different methods for calculating isoelectric point
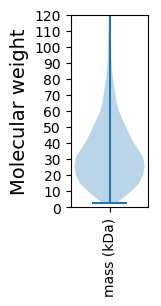
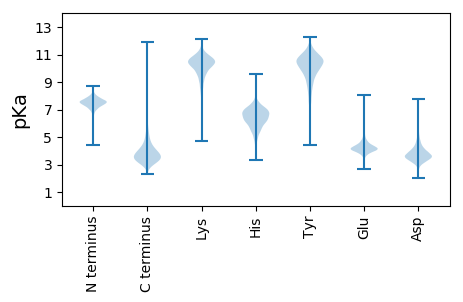
Summary statistics related to proteome-wise predictions


Protein with the lowest isoelectric point:
>tr|A0A1G8EYL0|A0A1G8EYL0_9PROT Uncharacterized protein OS=Roseospirillum parvum OX=83401 GN=SAMN05421742_11182 PE=4 SV=1
MM1 pKa = 7.31GNIVQSEE8 pKa = 4.02IAANQSNKK16 pKa = 8.85ATTANDD22 pKa = 3.21ALAEE26 pKa = 4.05IDD28 pKa = 4.04AGMTEE33 pKa = 4.51LLEE36 pKa = 5.96IDD38 pKa = 5.29LSTADD43 pKa = 3.54ATLTAAQYY51 pKa = 10.63RR52 pKa = 11.84GAFTVKK58 pKa = 7.91TTGNDD63 pKa = 3.47GTYY66 pKa = 10.66HH67 pKa = 7.2LALPAQKK74 pKa = 9.93RR75 pKa = 11.84ACGVYY80 pKa = 10.38NGGTGDD86 pKa = 4.05LNVTVGATTVTIPAATGYY104 pKa = 10.5HH105 pKa = 7.4LYY107 pKa = 10.37TDD109 pKa = 4.2GTTDD113 pKa = 3.52GLISLGGGGGEE124 pKa = 4.32SDD126 pKa = 5.19FIGLTDD132 pKa = 3.82TPTDD136 pKa = 3.52YY137 pKa = 11.53TNAAGRR143 pKa = 11.84AVMVNSTGNALEE155 pKa = 4.08FATVVEE161 pKa = 4.64QVGGWFDD168 pKa = 3.72GAPSASQTVFRR179 pKa = 11.84VALTDD184 pKa = 3.69ATDD187 pKa = 4.03LPADD191 pKa = 3.59LAGSVFRR198 pKa = 11.84AGTAPSGGDD207 pKa = 3.15DD208 pKa = 3.74VYY210 pKa = 11.61DD211 pKa = 3.76VQVAGASIGSVTFADD226 pKa = 4.74GATSGTASVTATACAAGDD244 pKa = 4.05VVALIAPTTLYY255 pKa = 11.0GSADD259 pKa = 3.52LTVTIKK265 pKa = 10.09GTLL268 pKa = 3.28
MM1 pKa = 7.31GNIVQSEE8 pKa = 4.02IAANQSNKK16 pKa = 8.85ATTANDD22 pKa = 3.21ALAEE26 pKa = 4.05IDD28 pKa = 4.04AGMTEE33 pKa = 4.51LLEE36 pKa = 5.96IDD38 pKa = 5.29LSTADD43 pKa = 3.54ATLTAAQYY51 pKa = 10.63RR52 pKa = 11.84GAFTVKK58 pKa = 7.91TTGNDD63 pKa = 3.47GTYY66 pKa = 10.66HH67 pKa = 7.2LALPAQKK74 pKa = 9.93RR75 pKa = 11.84ACGVYY80 pKa = 10.38NGGTGDD86 pKa = 4.05LNVTVGATTVTIPAATGYY104 pKa = 10.5HH105 pKa = 7.4LYY107 pKa = 10.37TDD109 pKa = 4.2GTTDD113 pKa = 3.52GLISLGGGGGEE124 pKa = 4.32SDD126 pKa = 5.19FIGLTDD132 pKa = 3.82TPTDD136 pKa = 3.52YY137 pKa = 11.53TNAAGRR143 pKa = 11.84AVMVNSTGNALEE155 pKa = 4.08FATVVEE161 pKa = 4.64QVGGWFDD168 pKa = 3.72GAPSASQTVFRR179 pKa = 11.84VALTDD184 pKa = 3.69ATDD187 pKa = 4.03LPADD191 pKa = 3.59LAGSVFRR198 pKa = 11.84AGTAPSGGDD207 pKa = 3.15DD208 pKa = 3.74VYY210 pKa = 11.61DD211 pKa = 3.76VQVAGASIGSVTFADD226 pKa = 4.74GATSGTASVTATACAAGDD244 pKa = 4.05VVALIAPTTLYY255 pKa = 11.0GSADD259 pKa = 3.52LTVTIKK265 pKa = 10.09GTLL268 pKa = 3.28
Molecular weight: 26.62 kDa
Isoelectric point according different methods:
Protein with the highest isoelectric point:
>tr|A0A1G7WQZ5|A0A1G7WQZ5_9PROT Nucleoside diphosphate kinase OS=Roseospirillum parvum OX=83401 GN=ndk PE=3 SV=1
MM1 pKa = 7.35KK2 pKa = 9.43RR3 pKa = 11.84TYY5 pKa = 10.29QPSKK9 pKa = 10.24LIRR12 pKa = 11.84KK13 pKa = 8.58RR14 pKa = 11.84RR15 pKa = 11.84HH16 pKa = 4.23GFRR19 pKa = 11.84ARR21 pKa = 11.84KK22 pKa = 7.68ATVGGRR28 pKa = 11.84RR29 pKa = 11.84VLAARR34 pKa = 11.84RR35 pKa = 11.84ARR37 pKa = 11.84GRR39 pKa = 11.84ARR41 pKa = 11.84LSAA44 pKa = 3.99
MM1 pKa = 7.35KK2 pKa = 9.43RR3 pKa = 11.84TYY5 pKa = 10.29QPSKK9 pKa = 10.24LIRR12 pKa = 11.84KK13 pKa = 8.58RR14 pKa = 11.84RR15 pKa = 11.84HH16 pKa = 4.23GFRR19 pKa = 11.84ARR21 pKa = 11.84KK22 pKa = 7.68ATVGGRR28 pKa = 11.84RR29 pKa = 11.84VLAARR34 pKa = 11.84RR35 pKa = 11.84ARR37 pKa = 11.84GRR39 pKa = 11.84ARR41 pKa = 11.84LSAA44 pKa = 3.99
Molecular weight: 5.12 kDa
Isoelectric point according different methods:
Peptides (in silico digests for buttom-up proteomics)
Below you can find in silico digests of the whole proteome with Trypsin, Chymotrypsin, Trypsin+LysC, LysN, ArgC proteases suitable for different mass spec machines.| Try ESI |
 |
|---|
| ChTry ESI |
 |
|---|
| ArgC ESI |
 |
|---|
| LysN ESI |
 |
|---|
| TryLysC ESI |
 |
|---|
| Try MALDI |
 |
|---|
| ChTry MALDI |
 |
|---|
| ArgC MALDI |
 |
|---|
| LysN MALDI |
 |
|---|
| TryLysC MALDI |
 |
|---|
| Try LTQ |
 |
|---|
| ChTry LTQ |
 |
|---|
| ArgC LTQ |
 |
|---|
| LysN LTQ |
 |
|---|
| TryLysC LTQ |
 |
|---|
| Try MSlow |
 |
|---|
| ChTry MSlow |
 |
|---|
| ArgC MSlow |
 |
|---|
| LysN MSlow |
 |
|---|
| TryLysC MSlow |
 |
|---|
| Try MShigh |
 |
|---|
| ChTry MShigh |
 |
|---|
| ArgC MShigh |
 |
|---|
| LysN MShigh |
 |
|---|
| TryLysC MShigh |
 |
|---|
General Statistics
Number of major isoforms |
Number of additional isoforms |
Number of all proteins |
Number of amino acids |
Min. Seq. Length |
Max. Seq. Length |
Avg. Seq. Length |
Avg. Mol. Weight |
|---|---|---|---|---|---|---|---|
0 |
1028483 |
25 |
5496 |
335.3 |
36.1 |
Amino acid frequency
Ala |
Cys |
Asp |
Glu |
Phe |
Gly |
His |
Ile |
Lys |
Leu |
|---|---|---|---|---|---|---|---|---|---|
13.501 ± 0.067 | 0.826 ± 0.013 |
6.018 ± 0.053 | 5.856 ± 0.038 |
3.16 ± 0.025 | 9.109 ± 0.046 |
2.273 ± 0.019 | 4.022 ± 0.034 |
2.482 ± 0.032 | 11.29 ± 0.054 |
Met |
Asn |
Gln |
Pro |
Arg |
Ser |
Thr |
Val |
Trp |
Tyr |
|---|---|---|---|---|---|---|---|---|---|
2.221 ± 0.022 | 2.098 ± 0.021 |
6.232 ± 0.048 | 3.005 ± 0.025 |
7.732 ± 0.056 | 4.451 ± 0.031 |
5.225 ± 0.04 | 7.327 ± 0.038 |
1.314 ± 0.018 | 1.858 ± 0.021 |
Most of the basic statistics you can see at this page can be downloaded from this CSV file
Proteome-pI is available under Creative Commons Attribution-NoDerivs license, for more details see here
| Reference: Kozlowski LP. Proteome-pI 2.0: Proteome Isoelectric Point Database Update. Nucleic Acids Res. 2021, doi: 10.1093/nar/gkab944 | Contact: Lukasz P. Kozlowski |
