Tieghemostelium lacteum
Taxonomy: cellular organisms; Eukaryota; Amoebozoa; Evosea; Eumycetozoa; Dictyostelia; Dictyosteliales; Raperosteliaceae; Tieghemostelium
Average proteome isoelectric point is 6.43
Get precalculated fractions of proteins

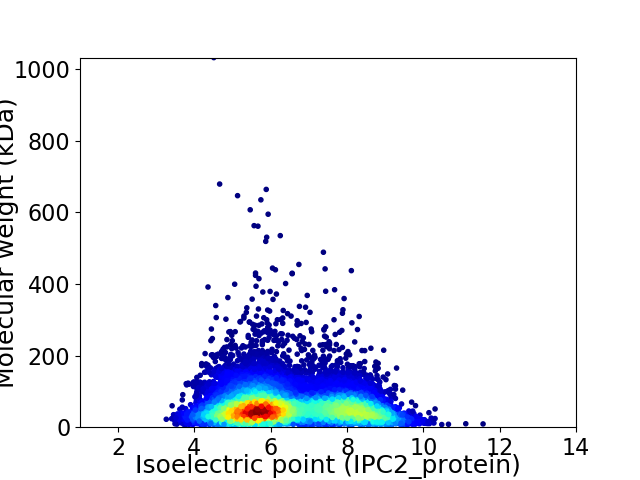
Virtual 2D-PAGE plot for 10208 proteins (isoelectric point calculated using IPC2_protein)
Get csv file with sequences according to given criteria:
* You can choose from 21 different methods for calculating isoelectric point
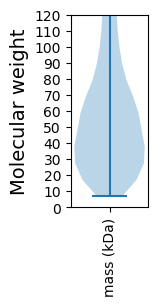
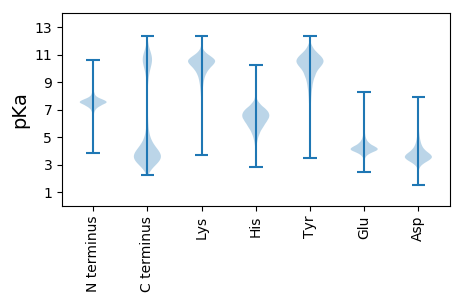
Summary statistics related to proteome-wise predictions


Protein with the lowest isoelectric point:
>tr|A0A152A2X9|A0A152A2X9_9MYCE ABC transporter D family protein OS=Tieghemostelium lacteum OX=361077 GN=DLAC_02605 PE=4 SV=1
MM1 pKa = 7.47YY2 pKa = 8.42STKK5 pKa = 10.71LFVLFNIFILSLALVNAEE23 pKa = 3.78IYY25 pKa = 10.26GLKK28 pKa = 9.84SQQEE32 pKa = 4.28VHH34 pKa = 7.12DD35 pKa = 5.27SISVINVGDD44 pKa = 3.4NDD46 pKa = 3.71VRR48 pKa = 11.84YY49 pKa = 8.17LTYY52 pKa = 10.36FSSLGDD58 pKa = 3.63FYY60 pKa = 11.83VSGVTANVDD69 pKa = 3.56STGQNADD76 pKa = 3.1VTTSAFYY83 pKa = 10.22FSSGTSSILNLPLSYY98 pKa = 10.43YY99 pKa = 10.33YY100 pKa = 10.72SYY102 pKa = 10.7ATASVSPGTVNAQGSVAAWAPSAIIEE128 pKa = 4.22YY129 pKa = 10.44EE130 pKa = 4.16EE131 pKa = 4.38NNGQAGFQLNSSDD144 pKa = 5.67KK145 pKa = 8.76VLGWIRR151 pKa = 11.84LDD153 pKa = 3.38LYY155 pKa = 11.53GNFDD159 pKa = 4.32IDD161 pKa = 4.31STDD164 pKa = 3.29QTITATANGNSISTKK179 pKa = 10.08VYY181 pKa = 9.98TIDD184 pKa = 3.64AVSPDD189 pKa = 3.96GIFALRR195 pKa = 11.84FVVSGAPVAIGEE207 pKa = 4.35DD208 pKa = 3.67VEE210 pKa = 4.54ITAEE214 pKa = 3.85QSKK217 pKa = 11.22ADD219 pKa = 3.75VVINDD224 pKa = 4.04YY225 pKa = 11.3YY226 pKa = 11.35DD227 pKa = 4.11SNVNQNSIGCDD238 pKa = 2.97ASEE241 pKa = 4.7PFLSCRR247 pKa = 11.84STGPSSNTNSRR258 pKa = 11.84LALASFFLAASFEE271 pKa = 4.17VDD273 pKa = 3.76ANIDD277 pKa = 3.51NDD279 pKa = 4.17AVSVDD284 pKa = 3.63AGDD287 pKa = 3.94VEE289 pKa = 5.99IGFNWVKK296 pKa = 9.61TVSVNNGQGSANVVAEE312 pKa = 4.8TYY314 pKa = 10.43ASKK317 pKa = 10.89DD318 pKa = 3.23GNSFINAKK326 pKa = 10.46FNGTYY331 pKa = 9.79SGQLIVHH338 pKa = 6.45SFDD341 pKa = 3.08TVRR344 pKa = 11.84PDD346 pKa = 3.17TVTWDD351 pKa = 3.54PTVGAGISSSSSAAVLKK368 pKa = 10.75VSAFMLFGLVLTLFII383 pKa = 5.56
MM1 pKa = 7.47YY2 pKa = 8.42STKK5 pKa = 10.71LFVLFNIFILSLALVNAEE23 pKa = 3.78IYY25 pKa = 10.26GLKK28 pKa = 9.84SQQEE32 pKa = 4.28VHH34 pKa = 7.12DD35 pKa = 5.27SISVINVGDD44 pKa = 3.4NDD46 pKa = 3.71VRR48 pKa = 11.84YY49 pKa = 8.17LTYY52 pKa = 10.36FSSLGDD58 pKa = 3.63FYY60 pKa = 11.83VSGVTANVDD69 pKa = 3.56STGQNADD76 pKa = 3.1VTTSAFYY83 pKa = 10.22FSSGTSSILNLPLSYY98 pKa = 10.43YY99 pKa = 10.33YY100 pKa = 10.72SYY102 pKa = 10.7ATASVSPGTVNAQGSVAAWAPSAIIEE128 pKa = 4.22YY129 pKa = 10.44EE130 pKa = 4.16EE131 pKa = 4.38NNGQAGFQLNSSDD144 pKa = 5.67KK145 pKa = 8.76VLGWIRR151 pKa = 11.84LDD153 pKa = 3.38LYY155 pKa = 11.53GNFDD159 pKa = 4.32IDD161 pKa = 4.31STDD164 pKa = 3.29QTITATANGNSISTKK179 pKa = 10.08VYY181 pKa = 9.98TIDD184 pKa = 3.64AVSPDD189 pKa = 3.96GIFALRR195 pKa = 11.84FVVSGAPVAIGEE207 pKa = 4.35DD208 pKa = 3.67VEE210 pKa = 4.54ITAEE214 pKa = 3.85QSKK217 pKa = 11.22ADD219 pKa = 3.75VVINDD224 pKa = 4.04YY225 pKa = 11.3YY226 pKa = 11.35DD227 pKa = 4.11SNVNQNSIGCDD238 pKa = 2.97ASEE241 pKa = 4.7PFLSCRR247 pKa = 11.84STGPSSNTNSRR258 pKa = 11.84LALASFFLAASFEE271 pKa = 4.17VDD273 pKa = 3.76ANIDD277 pKa = 3.51NDD279 pKa = 4.17AVSVDD284 pKa = 3.63AGDD287 pKa = 3.94VEE289 pKa = 5.99IGFNWVKK296 pKa = 9.61TVSVNNGQGSANVVAEE312 pKa = 4.8TYY314 pKa = 10.43ASKK317 pKa = 10.89DD318 pKa = 3.23GNSFINAKK326 pKa = 10.46FNGTYY331 pKa = 9.79SGQLIVHH338 pKa = 6.45SFDD341 pKa = 3.08TVRR344 pKa = 11.84PDD346 pKa = 3.17TVTWDD351 pKa = 3.54PTVGAGISSSSSAAVLKK368 pKa = 10.75VSAFMLFGLVLTLFII383 pKa = 5.56
Molecular weight: 40.68 kDa
Isoelectric point according different methods:
Protein with the highest isoelectric point:
>tr|A0A151ZEN2|A0A151ZEN2_9MYCE Trafficking protein particle complex subunit 2-like protein OS=Tieghemostelium lacteum OX=361077 GN=DLAC_06317 PE=4 SV=1
MM1 pKa = 7.93RR2 pKa = 11.84LFQQAQNNINNNNNHH17 pKa = 6.96RR18 pKa = 11.84DD19 pKa = 3.61RR20 pKa = 11.84EE21 pKa = 4.4PIPNRR26 pKa = 11.84HH27 pKa = 5.31SRR29 pKa = 11.84SRR31 pKa = 11.84SRR33 pKa = 11.84SRR35 pKa = 11.84SRR37 pKa = 11.84SRR39 pKa = 11.84SRR41 pKa = 11.84SRR43 pKa = 11.84SRR45 pKa = 11.84SRR47 pKa = 11.84SRR49 pKa = 11.84SRR51 pKa = 11.84SRR53 pKa = 11.84SRR55 pKa = 11.84SRR57 pKa = 11.84SRR59 pKa = 11.84SRR61 pKa = 11.84SRR63 pKa = 11.84SRR65 pKa = 11.84SRR67 pKa = 11.84SRR69 pKa = 11.84SSFLINRR76 pKa = 11.84KK77 pKa = 7.37TKK79 pKa = 10.41
MM1 pKa = 7.93RR2 pKa = 11.84LFQQAQNNINNNNNHH17 pKa = 6.96RR18 pKa = 11.84DD19 pKa = 3.61RR20 pKa = 11.84EE21 pKa = 4.4PIPNRR26 pKa = 11.84HH27 pKa = 5.31SRR29 pKa = 11.84SRR31 pKa = 11.84SRR33 pKa = 11.84SRR35 pKa = 11.84SRR37 pKa = 11.84SRR39 pKa = 11.84SRR41 pKa = 11.84SRR43 pKa = 11.84SRR45 pKa = 11.84SRR47 pKa = 11.84SRR49 pKa = 11.84SRR51 pKa = 11.84SRR53 pKa = 11.84SRR55 pKa = 11.84SRR57 pKa = 11.84SRR59 pKa = 11.84SRR61 pKa = 11.84SRR63 pKa = 11.84SRR65 pKa = 11.84SRR67 pKa = 11.84SRR69 pKa = 11.84SSFLINRR76 pKa = 11.84KK77 pKa = 7.37TKK79 pKa = 10.41
Molecular weight: 9.63 kDa
Isoelectric point according different methods:
Peptides (in silico digests for buttom-up proteomics)
Below you can find in silico digests of the whole proteome with Trypsin, Chymotrypsin, Trypsin+LysC, LysN, ArgC proteases suitable for different mass spec machines.| Try ESI |
 |
|---|
| ChTry ESI |
 |
|---|
| ArgC ESI |
 |
|---|
| LysN ESI |
 |
|---|
| TryLysC ESI |
 |
|---|
| Try MALDI |
 |
|---|
| ChTry MALDI |
 |
|---|
| ArgC MALDI |
 |
|---|
| LysN MALDI |
 |
|---|
| TryLysC MALDI |
 |
|---|
| Try LTQ |
 |
|---|
| ChTry LTQ |
 |
|---|
| ArgC LTQ |
 |
|---|
| LysN LTQ |
 |
|---|
| TryLysC LTQ |
 |
|---|
| Try MSlow |
 |
|---|
| ChTry MSlow |
 |
|---|
| ArgC MSlow |
 |
|---|
| LysN MSlow |
 |
|---|
| TryLysC MSlow |
 |
|---|
| Try MShigh |
 |
|---|
| ChTry MShigh |
 |
|---|
| ArgC MShigh |
 |
|---|
| LysN MShigh |
 |
|---|
| TryLysC MShigh |
 |
|---|
General Statistics
Number of major isoforms |
Number of additional isoforms |
Number of all proteins |
Number of amino acids |
Min. Seq. Length |
Max. Seq. Length |
Avg. Seq. Length |
Avg. Mol. Weight |
|---|---|---|---|---|---|---|---|
0 |
5820820 |
66 |
9353 |
570.2 |
64.8 |
Amino acid frequency
Ala |
Cys |
Asp |
Glu |
Phe |
Gly |
His |
Ile |
Lys |
Leu |
|---|---|---|---|---|---|---|---|---|---|
3.539 ± 0.019 | 1.418 ± 0.011 |
5.366 ± 0.014 | 5.743 ± 0.025 |
4.574 ± 0.019 | 4.48 ± 0.023 |
2.066 ± 0.012 | 7.965 ± 0.022 |
7.309 ± 0.026 | 9.467 ± 0.031 |
Met |
Asn |
Gln |
Pro |
Arg |
Ser |
Thr |
Val |
Trp |
Tyr |
|---|---|---|---|---|---|---|---|---|---|
1.889 ± 0.008 | 7.694 ± 0.029 |
4.378 ± 0.019 | 5.203 ± 0.027 |
3.098 ± 0.014 | 9.557 ± 0.03 |
6.383 ± 0.026 | 5.093 ± 0.017 |
0.822 ± 0.007 | 3.956 ± 0.018 |
Most of the basic statistics you can see at this page can be downloaded from this CSV file
Proteome-pI is available under Creative Commons Attribution-NoDerivs license, for more details see here
| Reference: Kozlowski LP. Proteome-pI 2.0: Proteome Isoelectric Point Database Update. Nucleic Acids Res. 2021, doi: 10.1093/nar/gkab944 | Contact: Lukasz P. Kozlowski |
