Candidatus Phytoplasma pini
Taxonomy: cellular organisms; Bacteria; Terrabacteria group; Tenericutes; Mollicutes; Acholeplasmatales; Acholeplasmataceae; Candidatus Phytoplasma; 16SrXXI (Pine shoot proliferation group)
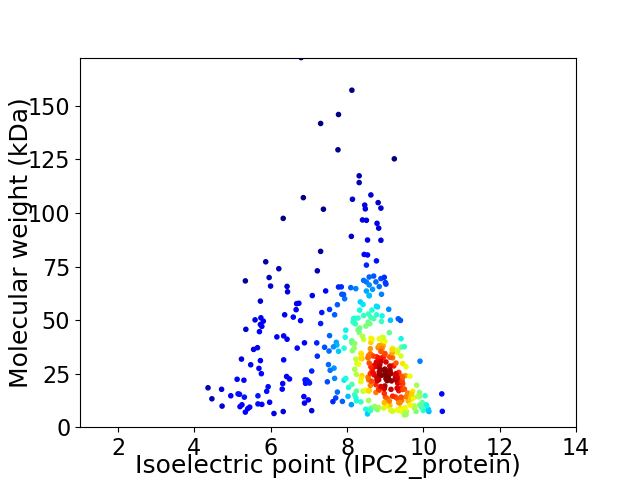
Average proteome isoelectric point is 8.13
Get precalculated fractions of proteins

Virtual 2D-PAGE plot for 404 proteins (isoelectric point calculated using IPC2_protein)
Get csv file with sequences according to given criteria:
* You can choose from 21 different methods for calculating isoelectric point
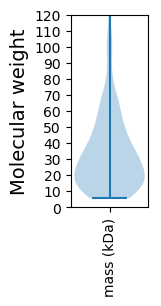
Summary statistics related to proteome-wise predictions


Protein with the lowest isoelectric point:
>tr|A0A559KJU8|A0A559KJU8_9MOLU Poly(A)polymerase OS=Candidatus Phytoplasma pini OX=267362 GN=pcnB PE=3 SV=1
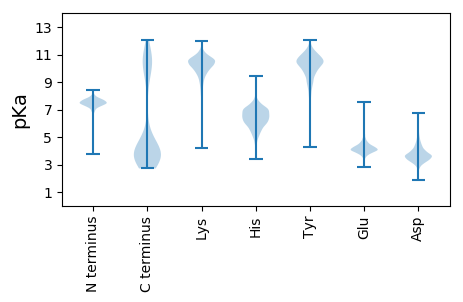
MM1 pKa = 7.47KK2 pKa = 10.2KK3 pKa = 10.27KK4 pKa = 10.69NSIQNDD10 pKa = 3.75LNIVNSISMLEE21 pKa = 3.87LSYY24 pKa = 11.07QILEE28 pKa = 4.26NNRR31 pKa = 11.84DD32 pKa = 3.49PMSIHH37 pKa = 5.84QLIKK41 pKa = 10.57KK42 pKa = 8.28VLEE45 pKa = 3.92MKK47 pKa = 10.55KK48 pKa = 9.89IDD50 pKa = 3.59ISDD53 pKa = 3.67EE54 pKa = 4.1NKK56 pKa = 9.97ISQLYY61 pKa = 10.33LDD63 pKa = 5.42IILSGRR69 pKa = 11.84FVFHH73 pKa = 7.37GNDD76 pKa = 2.74LWSIKK81 pKa = 10.23KK82 pKa = 10.23NNLSLWDD89 pKa = 3.54QEE91 pKa = 4.53YY92 pKa = 10.57FILDD96 pKa = 3.91TIEE99 pKa = 4.14EE100 pKa = 4.1KK101 pKa = 10.9LINDD105 pKa = 3.81EE106 pKa = 4.88EE107 pKa = 4.34ILDD110 pKa = 3.73FDD112 pKa = 4.93EE113 pKa = 5.56FVLRR117 pKa = 11.84NKK119 pKa = 9.92KK120 pKa = 10.47KK121 pKa = 10.21KK122 pKa = 10.65DD123 pKa = 3.31NTEE126 pKa = 3.93EE127 pKa = 4.0EE128 pKa = 3.83KK129 pKa = 10.88DD130 pKa = 3.59ANNFEE135 pKa = 4.74HH136 pKa = 7.58LDD138 pKa = 3.55EE139 pKa = 5.45ALEE142 pKa = 4.47DD143 pKa = 3.91NEE145 pKa = 4.81EE146 pKa = 4.06DD147 pKa = 5.81LIDD150 pKa = 4.03EE151 pKa = 4.93DD152 pKa = 5.03EE153 pKa = 4.38YY154 pKa = 12.04
MM1 pKa = 7.47KK2 pKa = 10.2KK3 pKa = 10.27KK4 pKa = 10.69NSIQNDD10 pKa = 3.75LNIVNSISMLEE21 pKa = 3.87LSYY24 pKa = 11.07QILEE28 pKa = 4.26NNRR31 pKa = 11.84DD32 pKa = 3.49PMSIHH37 pKa = 5.84QLIKK41 pKa = 10.57KK42 pKa = 8.28VLEE45 pKa = 3.92MKK47 pKa = 10.55KK48 pKa = 9.89IDD50 pKa = 3.59ISDD53 pKa = 3.67EE54 pKa = 4.1NKK56 pKa = 9.97ISQLYY61 pKa = 10.33LDD63 pKa = 5.42IILSGRR69 pKa = 11.84FVFHH73 pKa = 7.37GNDD76 pKa = 2.74LWSIKK81 pKa = 10.23KK82 pKa = 10.23NNLSLWDD89 pKa = 3.54QEE91 pKa = 4.53YY92 pKa = 10.57FILDD96 pKa = 3.91TIEE99 pKa = 4.14EE100 pKa = 4.1KK101 pKa = 10.9LINDD105 pKa = 3.81EE106 pKa = 4.88EE107 pKa = 4.34ILDD110 pKa = 3.73FDD112 pKa = 4.93EE113 pKa = 5.56FVLRR117 pKa = 11.84NKK119 pKa = 9.92KK120 pKa = 10.47KK121 pKa = 10.21KK122 pKa = 10.65DD123 pKa = 3.31NTEE126 pKa = 3.93EE127 pKa = 4.0EE128 pKa = 3.83KK129 pKa = 10.88DD130 pKa = 3.59ANNFEE135 pKa = 4.74HH136 pKa = 7.58LDD138 pKa = 3.55EE139 pKa = 5.45ALEE142 pKa = 4.47DD143 pKa = 3.91NEE145 pKa = 4.81EE146 pKa = 4.06DD147 pKa = 5.81LIDD150 pKa = 4.03EE151 pKa = 4.93DD152 pKa = 5.03EE153 pKa = 4.38YY154 pKa = 12.04
Molecular weight: 18.4 kDa
Isoelectric point according different methods:
Protein with the highest isoelectric point:
>tr|A0A559KIZ5|A0A559KIZ5_9MOLU Glycerol-3-phosphate acyltransferase OS=Candidatus Phytoplasma pini OX=267362 GN=plsY PE=3 SV=1
EEE2 pKa = 3.8TKKK5 pKa = 10.79YY6 pKa = 10.63RR7 pKa = 11.84GKKK10 pKa = 9.96YY11 pKa = 9.28GEEE14 pKa = 3.8MKKK17 pKa = 11.05KKK19 pKa = 10.73IRR21 pKa = 11.84FHHH24 pKa = 6.54DD25 pKa = 4.08VANRR29 pKa = 11.84MNYYY33 pKa = 8.88KK34 pKa = 10.18NAVYYY39 pKa = 9.73PTLPLKKK46 pKa = 10.81NGKKK50 pKa = 8.1VSFIPKKK57 pKa = 8.86RR58 pKa = 11.84KKK60 pKa = 9.06SEEE63 pKa = 4.48DD64 pKa = 3.7YY65 pKa = 11.43NGITMTLRR73 pKa = 11.84SDDD76 pKa = 3.69APCKKK81 pKa = 10.37RR82 pKa = 11.84SQRR85 pKa = 11.84TQKKK89 pKa = 10.58NNSRR93 pKa = 11.84VLLLN
EEE2 pKa = 3.8TKKK5 pKa = 10.79YY6 pKa = 10.63RR7 pKa = 11.84GKKK10 pKa = 9.96YY11 pKa = 9.28GEEE14 pKa = 3.8MKKK17 pKa = 11.05KKK19 pKa = 10.73IRR21 pKa = 11.84FHHH24 pKa = 6.54DD25 pKa = 4.08VANRR29 pKa = 11.84MNYYY33 pKa = 8.88KK34 pKa = 10.18NAVYYY39 pKa = 9.73PTLPLKKK46 pKa = 10.81NGKKK50 pKa = 8.1VSFIPKKK57 pKa = 8.86RR58 pKa = 11.84KKK60 pKa = 9.06SEEE63 pKa = 4.48DD64 pKa = 3.7YY65 pKa = 11.43NGITMTLRR73 pKa = 11.84SDDD76 pKa = 3.69APCKKK81 pKa = 10.37RR82 pKa = 11.84SQRR85 pKa = 11.84TQKKK89 pKa = 10.58NNSRR93 pKa = 11.84VLLLN
Molecular weight: 11.47 kDa
Isoelectric point according different methods:
Peptides (in silico digests for buttom-up proteomics)
Below you can find in silico digests of the whole proteome with Trypsin, Chymotrypsin, Trypsin+LysC, LysN, ArgC proteases suitable for different mass spec machines.| Try ESI |
 |
|---|
| ChTry ESI |
 |
|---|
| ArgC ESI |
 |
|---|
| LysN ESI |
 |
|---|
| TryLysC ESI |
 |
|---|
| Try MALDI |
 |
|---|
| ChTry MALDI |
 |
|---|
| ArgC MALDI |
 |
|---|
| LysN MALDI |
 |
|---|
| TryLysC MALDI |
 |
|---|
| Try LTQ |
 |
|---|
| ChTry LTQ |
 |
|---|
| ArgC LTQ |
 |
|---|
| LysN LTQ |
 |
|---|
| TryLysC LTQ |
 |
|---|
| Try MSlow |
 |
|---|
| ChTry MSlow |
 |
|---|
| ArgC MSlow |
 |
|---|
| LysN MSlow |
 |
|---|
| TryLysC MSlow |
 |
|---|
| Try MShigh |
 |
|---|
| ChTry MShigh |
 |
|---|
| ArgC MShigh |
 |
|---|
| LysN MShigh |
 |
|---|
| TryLysC MShigh |
 |
|---|
General Statistics
Number of major isoforms |
Number of additional isoforms |
Number of all proteins |
Number of amino acids |
Min. Seq. Length |
Max. Seq. Length |
Avg. Seq. Length |
Avg. Mol. Weight |
|---|---|---|---|---|---|---|---|
0 |
123395 |
50 |
1471 |
305.4 |
35.59 |
Amino acid frequency
Ala |
Cys |
Asp |
Glu |
Phe |
Gly |
His |
Ile |
Lys |
Leu |
|---|---|---|---|---|---|---|---|---|---|
3.311 ± 0.099 | 0.908 ± 0.029 |
4.777 ± 0.079 | 6.484 ± 0.116 |
6.781 ± 0.147 | 4.159 ± 0.118 |
1.693 ± 0.041 | 11.556 ± 0.125 |
11.831 ± 0.143 | 10.561 ± 0.129 |
Met |
Asn |
Gln |
Pro |
Arg |
Ser |
Thr |
Val |
Trp |
Tyr |
|---|---|---|---|---|---|---|---|---|---|
1.681 ± 0.036 | 7.663 ± 0.124 |
2.453 ± 0.049 | 4.107 ± 0.083 |
2.806 ± 0.081 | 6.214 ± 0.084 |
4.019 ± 0.078 | 4.374 ± 0.089 |
0.489 ± 0.031 | 4.132 ± 0.068 |
Most of the basic statistics you can see at this page can be downloaded from this CSV file
Proteome-pI is available under Creative Commons Attribution-NoDerivs license, for more details see here
| Reference: Kozlowski LP. Proteome-pI 2.0: Proteome Isoelectric Point Database Update. Nucleic Acids Res. 2021, doi: 10.1093/nar/gkab944 | Contact: Lukasz P. Kozlowski |
