Bdellovibrio bacteriovorus (strain ATCC 15356 / DSM 50701 / NCIMB 9529 / HD100)
Taxonomy: cellular organisms; Bacteria; Proteobacteria; Oligoflexia; Bdellovibrionales; Bdellovibrionaceae; Bdellovibrio; Bdellovibrio bacteriovorus
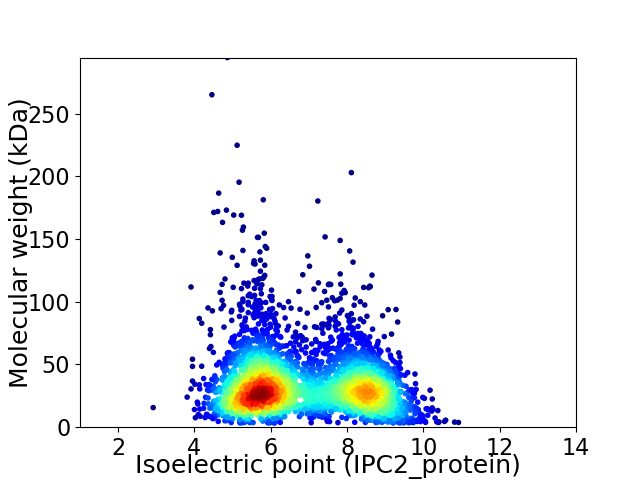
Average proteome isoelectric point is 6.82
Get precalculated fractions of proteins

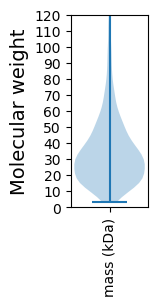
Virtual 2D-PAGE plot for 3583 proteins (isoelectric point calculated using IPC2_protein)
Get csv file with sequences according to given criteria:
* You can choose from 21 different methods for calculating isoelectric point
Summary statistics related to proteome-wise predictions


Protein with the lowest isoelectric point:
>tr|Q6MR45|Q6MR45_BDEBA Excinuclease ABC subunit C OS=Bdellovibrio bacteriovorus (strain ATCC 15356 / DSM 50701 / NCIMB 9529 / HD100) OX=264462 GN=uvrC PE=4 SV=1
MM1 pKa = 7.63ASCPSCHH8 pKa = 6.2QPVEE12 pKa = 4.22ILDD15 pKa = 3.7KK16 pKa = 11.19HH17 pKa = 6.67LGTLFTCSHH26 pKa = 6.58CNAVFFVDD34 pKa = 3.59WNGQPEE40 pKa = 4.39MAQHH44 pKa = 5.9EE45 pKa = 4.68PEE47 pKa = 5.1PEE49 pKa = 4.0TPAEE53 pKa = 4.29SFSEE57 pKa = 4.21PAQSFQNGTDD67 pKa = 3.81FQGGQDD73 pKa = 3.77FQQPGNDD80 pKa = 3.88FVPPIQDD87 pKa = 3.45FSAPQEE93 pKa = 4.2TFTPDD98 pKa = 2.8NSIPEE103 pKa = 3.92QSYY106 pKa = 10.86QDD108 pKa = 3.14QSYY111 pKa = 11.63SNEE114 pKa = 3.72QQYY117 pKa = 11.3AEE119 pKa = 4.04QAYY122 pKa = 9.76EE123 pKa = 3.99PSQDD127 pKa = 3.96PGMMAPPQDD136 pKa = 3.46NVSYY140 pKa = 10.61AEE142 pKa = 3.95PVEE145 pKa = 4.49VPGEE149 pKa = 4.1VPPMEE154 pKa = 4.28EE155 pKa = 3.49TPYY158 pKa = 11.26DD159 pKa = 4.05FSQTLDD165 pKa = 3.62SVNSQPLNEE174 pKa = 4.5PAPMSSDD181 pKa = 3.02TADD184 pKa = 3.6FSDD187 pKa = 3.63VTDD190 pKa = 4.48FANADD195 pKa = 3.78TAVGPLAYY203 pKa = 9.01TVTIDD208 pKa = 4.17GIEE211 pKa = 4.14SSRR214 pKa = 11.84LLAQLRR220 pKa = 11.84EE221 pKa = 4.02AMTDD225 pKa = 3.39SRR227 pKa = 11.84FGWDD231 pKa = 3.17VADD234 pKa = 4.61LLSHH238 pKa = 6.22VGGGRR243 pKa = 11.84LILHH247 pKa = 7.1GLTPAKK253 pKa = 10.45ASVLINRR260 pKa = 11.84IKK262 pKa = 10.64YY263 pKa = 10.35LPFKK267 pKa = 10.54ISWRR271 pKa = 11.84QDD273 pKa = 3.29VLSGSS278 pKa = 3.67
MM1 pKa = 7.63ASCPSCHH8 pKa = 6.2QPVEE12 pKa = 4.22ILDD15 pKa = 3.7KK16 pKa = 11.19HH17 pKa = 6.67LGTLFTCSHH26 pKa = 6.58CNAVFFVDD34 pKa = 3.59WNGQPEE40 pKa = 4.39MAQHH44 pKa = 5.9EE45 pKa = 4.68PEE47 pKa = 5.1PEE49 pKa = 4.0TPAEE53 pKa = 4.29SFSEE57 pKa = 4.21PAQSFQNGTDD67 pKa = 3.81FQGGQDD73 pKa = 3.77FQQPGNDD80 pKa = 3.88FVPPIQDD87 pKa = 3.45FSAPQEE93 pKa = 4.2TFTPDD98 pKa = 2.8NSIPEE103 pKa = 3.92QSYY106 pKa = 10.86QDD108 pKa = 3.14QSYY111 pKa = 11.63SNEE114 pKa = 3.72QQYY117 pKa = 11.3AEE119 pKa = 4.04QAYY122 pKa = 9.76EE123 pKa = 3.99PSQDD127 pKa = 3.96PGMMAPPQDD136 pKa = 3.46NVSYY140 pKa = 10.61AEE142 pKa = 3.95PVEE145 pKa = 4.49VPGEE149 pKa = 4.1VPPMEE154 pKa = 4.28EE155 pKa = 3.49TPYY158 pKa = 11.26DD159 pKa = 4.05FSQTLDD165 pKa = 3.62SVNSQPLNEE174 pKa = 4.5PAPMSSDD181 pKa = 3.02TADD184 pKa = 3.6FSDD187 pKa = 3.63VTDD190 pKa = 4.48FANADD195 pKa = 3.78TAVGPLAYY203 pKa = 9.01TVTIDD208 pKa = 4.17GIEE211 pKa = 4.14SSRR214 pKa = 11.84LLAQLRR220 pKa = 11.84EE221 pKa = 4.02AMTDD225 pKa = 3.39SRR227 pKa = 11.84FGWDD231 pKa = 3.17VADD234 pKa = 4.61LLSHH238 pKa = 6.22VGGGRR243 pKa = 11.84LILHH247 pKa = 7.1GLTPAKK253 pKa = 10.45ASVLINRR260 pKa = 11.84IKK262 pKa = 10.64YY263 pKa = 10.35LPFKK267 pKa = 10.54ISWRR271 pKa = 11.84QDD273 pKa = 3.29VLSGSS278 pKa = 3.67
Molecular weight: 30.53 kDa
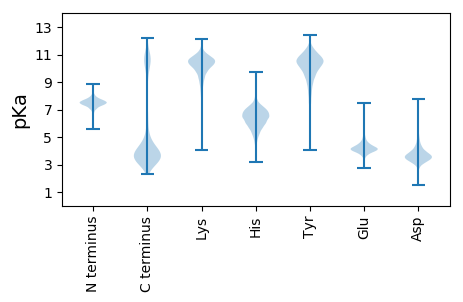
Isoelectric point according different methods:
Protein with the highest isoelectric point:
>tr|Q6ML37|Q6ML37_BDEBA Histidine kinase OS=Bdellovibrio bacteriovorus (strain ATCC 15356 / DSM 50701 / NCIMB 9529 / HD100) OX=264462 GN=Bd2184 PE=4 SV=1
MM1 pKa = 7.34QKK3 pKa = 10.1QKK5 pKa = 11.02NIKK8 pKa = 9.58QRR10 pKa = 11.84VTRR13 pKa = 11.84AGTFKK18 pKa = 9.9KK19 pKa = 9.13TKK21 pKa = 10.24AKK23 pKa = 10.43LFLVMRR29 pKa = 11.84ALSRR33 pKa = 11.84GLL35 pKa = 3.39
MM1 pKa = 7.34QKK3 pKa = 10.1QKK5 pKa = 11.02NIKK8 pKa = 9.58QRR10 pKa = 11.84VTRR13 pKa = 11.84AGTFKK18 pKa = 9.9KK19 pKa = 9.13TKK21 pKa = 10.24AKK23 pKa = 10.43LFLVMRR29 pKa = 11.84ALSRR33 pKa = 11.84GLL35 pKa = 3.39
Molecular weight: 4.08 kDa
Isoelectric point according different methods:
Peptides (in silico digests for buttom-up proteomics)
Below you can find in silico digests of the whole proteome with Trypsin, Chymotrypsin, Trypsin+LysC, LysN, ArgC proteases suitable for different mass spec machines.| Try ESI |
 |
|---|
| ChTry ESI |
 |
|---|
| ArgC ESI |
 |
|---|
| LysN ESI |
 |
|---|
| TryLysC ESI |
 |
|---|
| Try MALDI |
 |
|---|
| ChTry MALDI |
 |
|---|
| ArgC MALDI |
 |
|---|
| LysN MALDI |
 |
|---|
| TryLysC MALDI |
 |
|---|
| Try LTQ |
 |
|---|
| ChTry LTQ |
 |
|---|
| ArgC LTQ |
 |
|---|
| LysN LTQ |
 |
|---|
| TryLysC LTQ |
 |
|---|
| Try MSlow |
 |
|---|
| ChTry MSlow |
 |
|---|
| ArgC MSlow |
 |
|---|
| LysN MSlow |
 |
|---|
| TryLysC MSlow |
 |
|---|
| Try MShigh |
 |
|---|
| ChTry MShigh |
 |
|---|
| ArgC MShigh |
 |
|---|
| LysN MShigh |
 |
|---|
| TryLysC MShigh |
 |
|---|
General Statistics
Number of major isoforms |
Number of additional isoforms |
Number of all proteins |
Number of amino acids |
Min. Seq. Length |
Max. Seq. Length |
Avg. Seq. Length |
Avg. Mol. Weight |
|---|---|---|---|---|---|---|---|
0 |
1168751 |
30 |
2828 |
326.2 |
36.21 |
Amino acid frequency
Ala |
Cys |
Asp |
Glu |
Phe |
Gly |
His |
Ile |
Lys |
Leu |
|---|---|---|---|---|---|---|---|---|---|
8.48 ± 0.041 | 0.96 ± 0.018 |
5.132 ± 0.031 | 6.29 ± 0.046 |
4.484 ± 0.029 | 7.215 ± 0.047 |
1.899 ± 0.019 | 5.603 ± 0.034 |
6.54 ± 0.048 | 9.778 ± 0.052 |
Met |
Asn |
Gln |
Pro |
Arg |
Ser |
Thr |
Val |
Trp |
Tyr |
|---|---|---|---|---|---|---|---|---|---|
2.689 ± 0.019 | 4.139 ± 0.031 |
4.198 ± 0.029 | 3.95 ± 0.032 |
4.768 ± 0.027 | 6.935 ± 0.039 |
5.566 ± 0.052 | 7.108 ± 0.031 |
1.207 ± 0.017 | 3.057 ± 0.022 |
Most of the basic statistics you can see at this page can be downloaded from this CSV file
Proteome-pI is available under Creative Commons Attribution-NoDerivs license, for more details see here
| Reference: Kozlowski LP. Proteome-pI 2.0: Proteome Isoelectric Point Database Update. Nucleic Acids Res. 2021, doi: 10.1093/nar/gkab944 | Contact: Lukasz P. Kozlowski |
