Clostridiales bacterium KA00274
Taxonomy: cellular organisms; Bacteria; Terrabacteria group; Firmicutes; Clostridia; Eubacteriales; unclassified Eubacteriales
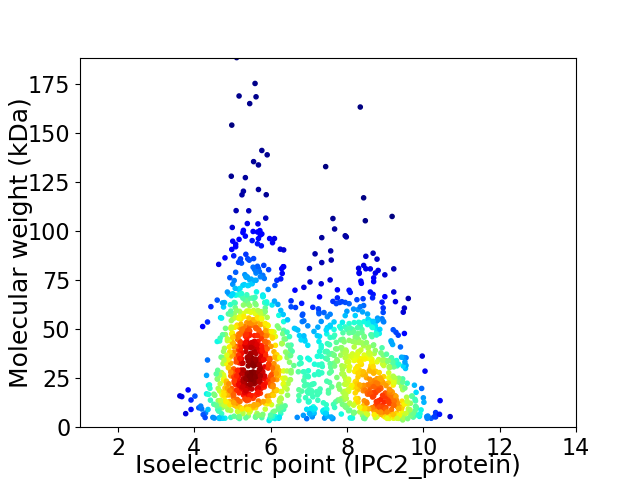
Average proteome isoelectric point is 6.76
Get precalculated fractions of proteins

Virtual 2D-PAGE plot for 1471 proteins (isoelectric point calculated using IPC2_protein)
Get csv file with sequences according to given criteria:
* You can choose from 21 different methods for calculating isoelectric point
Summary statistics related to proteome-wise predictions


Protein with the lowest isoelectric point:
>tr|A0A133Y7L2|A0A133Y7L2_9FIRM Putative proton-coupled thiamine transporter YuaJ OS=Clostridiales bacterium KA00274 OX=1497955 GN=HMPREF1872_01209 PE=4 SV=1
MM1 pKa = 7.12KK2 pKa = 10.57VSVAYY7 pKa = 10.64YY8 pKa = 10.38SEE10 pKa = 4.15TGNTQEE16 pKa = 4.82LADD19 pKa = 4.38MLTAALQTEE28 pKa = 4.4GAEE31 pKa = 4.35VYY33 pKa = 7.55EE34 pKa = 4.45TAVSDD39 pKa = 3.74VDD41 pKa = 3.68SSEE44 pKa = 4.75FLDD47 pKa = 4.02SDD49 pKa = 4.22LLVFATPATGTEE61 pKa = 4.25EE62 pKa = 3.72IDD64 pKa = 3.75QIEE67 pKa = 4.31MQAFIDD73 pKa = 5.2DD74 pKa = 3.85IASQLSGRR82 pKa = 11.84KK83 pKa = 8.98VFLCGTFGWGDD94 pKa = 3.86GEE96 pKa = 5.65YY97 pKa = 9.35MQAWQEE103 pKa = 3.79AMADD107 pKa = 4.05LGCQFAHH114 pKa = 6.95EE115 pKa = 4.83PFTCLEE121 pKa = 4.23SPDD124 pKa = 5.27DD125 pKa = 3.79EE126 pKa = 7.1AEE128 pKa = 4.35DD129 pKa = 3.78KK130 pKa = 10.98LAEE133 pKa = 3.96IAKK136 pKa = 9.91EE137 pKa = 3.92LFRR140 pKa = 11.84SII142 pKa = 4.58
MM1 pKa = 7.12KK2 pKa = 10.57VSVAYY7 pKa = 10.64YY8 pKa = 10.38SEE10 pKa = 4.15TGNTQEE16 pKa = 4.82LADD19 pKa = 4.38MLTAALQTEE28 pKa = 4.4GAEE31 pKa = 4.35VYY33 pKa = 7.55EE34 pKa = 4.45TAVSDD39 pKa = 3.74VDD41 pKa = 3.68SSEE44 pKa = 4.75FLDD47 pKa = 4.02SDD49 pKa = 4.22LLVFATPATGTEE61 pKa = 4.25EE62 pKa = 3.72IDD64 pKa = 3.75QIEE67 pKa = 4.31MQAFIDD73 pKa = 5.2DD74 pKa = 3.85IASQLSGRR82 pKa = 11.84KK83 pKa = 8.98VFLCGTFGWGDD94 pKa = 3.86GEE96 pKa = 5.65YY97 pKa = 9.35MQAWQEE103 pKa = 3.79AMADD107 pKa = 4.05LGCQFAHH114 pKa = 6.95EE115 pKa = 4.83PFTCLEE121 pKa = 4.23SPDD124 pKa = 5.27DD125 pKa = 3.79EE126 pKa = 7.1AEE128 pKa = 4.35DD129 pKa = 3.78KK130 pKa = 10.98LAEE133 pKa = 3.96IAKK136 pKa = 9.91EE137 pKa = 3.92LFRR140 pKa = 11.84SII142 pKa = 4.58
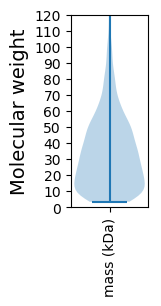
Molecular weight: 15.6 kDa
Isoelectric point according different methods:
Protein with the highest isoelectric point:
>tr|A0A133Y7S0|A0A133Y7S0_9FIRM Cell division protein FtsZ OS=Clostridiales bacterium KA00274 OX=1497955 GN=ftsZ PE=3 SV=1
MM1 pKa = 7.6AVPKK5 pKa = 10.43RR6 pKa = 11.84RR7 pKa = 11.84WSKK10 pKa = 9.16EE11 pKa = 2.98RR12 pKa = 11.84SRR14 pKa = 11.84RR15 pKa = 11.84SRR17 pKa = 11.84SNWKK21 pKa = 9.66LVAPALVEE29 pKa = 4.06CTSCHH34 pKa = 6.21EE35 pKa = 4.08LRR37 pKa = 11.84QAHH40 pKa = 6.4RR41 pKa = 11.84PCKK44 pKa = 9.78ACGVYY49 pKa = 10.14RR50 pKa = 11.84GRR52 pKa = 11.84QVIDD56 pKa = 3.25VAKK59 pKa = 10.94AEE61 pKa = 4.13
MM1 pKa = 7.6AVPKK5 pKa = 10.43RR6 pKa = 11.84RR7 pKa = 11.84WSKK10 pKa = 9.16EE11 pKa = 2.98RR12 pKa = 11.84SRR14 pKa = 11.84RR15 pKa = 11.84SRR17 pKa = 11.84SNWKK21 pKa = 9.66LVAPALVEE29 pKa = 4.06CTSCHH34 pKa = 6.21EE35 pKa = 4.08LRR37 pKa = 11.84QAHH40 pKa = 6.4RR41 pKa = 11.84PCKK44 pKa = 9.78ACGVYY49 pKa = 10.14RR50 pKa = 11.84GRR52 pKa = 11.84QVIDD56 pKa = 3.25VAKK59 pKa = 10.94AEE61 pKa = 4.13
Molecular weight: 7.06 kDa
Isoelectric point according different methods:
Peptides (in silico digests for buttom-up proteomics)
Below you can find in silico digests of the whole proteome with Trypsin, Chymotrypsin, Trypsin+LysC, LysN, ArgC proteases suitable for different mass spec machines.| Try ESI |
 |
|---|
| ChTry ESI |
 |
|---|
| ArgC ESI |
 |
|---|
| LysN ESI |
 |
|---|
| TryLysC ESI |
 |
|---|
| Try MALDI |
 |
|---|
| ChTry MALDI |
 |
|---|
| ArgC MALDI |
 |
|---|
| LysN MALDI |
 |
|---|
| TryLysC MALDI |
 |
|---|
| Try LTQ |
 |
|---|
| ChTry LTQ |
 |
|---|
| ArgC LTQ |
 |
|---|
| LysN LTQ |
 |
|---|
| TryLysC LTQ |
 |
|---|
| Try MSlow |
 |
|---|
| ChTry MSlow |
 |
|---|
| ArgC MSlow |
 |
|---|
| LysN MSlow |
 |
|---|
| TryLysC MSlow |
 |
|---|
| Try MShigh |
 |
|---|
| ChTry MShigh |
 |
|---|
| ArgC MShigh |
 |
|---|
| LysN MShigh |
 |
|---|
| TryLysC MShigh |
 |
|---|
General Statistics
Number of major isoforms |
Number of additional isoforms |
Number of all proteins |
Number of amino acids |
Min. Seq. Length |
Max. Seq. Length |
Avg. Seq. Length |
Avg. Mol. Weight |
|---|---|---|---|---|---|---|---|
0 |
464541 |
31 |
1684 |
315.8 |
35.45 |
Amino acid frequency
Ala |
Cys |
Asp |
Glu |
Phe |
Gly |
His |
Ile |
Lys |
Leu |
|---|---|---|---|---|---|---|---|---|---|
8.552 ± 0.055 | 1.373 ± 0.023 |
5.228 ± 0.055 | 6.37 ± 0.053 |
4.328 ± 0.049 | 5.605 ± 0.059 |
1.781 ± 0.027 | 6.72 ± 0.057 |
7.36 ± 0.056 | 11.198 ± 0.098 |
Met |
Asn |
Gln |
Pro |
Arg |
Ser |
Thr |
Val |
Trp |
Tyr |
|---|---|---|---|---|---|---|---|---|---|
2.427 ± 0.03 | 5.07 ± 0.043 |
3.303 ± 0.032 | 4.18 ± 0.048 |
3.951 ± 0.048 | 6.212 ± 0.043 |
5.157 ± 0.039 | 6.313 ± 0.052 |
0.923 ± 0.021 | 3.948 ± 0.036 |
Most of the basic statistics you can see at this page can be downloaded from this CSV file
Proteome-pI is available under Creative Commons Attribution-NoDerivs license, for more details see here
| Reference: Kozlowski LP. Proteome-pI 2.0: Proteome Isoelectric Point Database Update. Nucleic Acids Res. 2021, doi: 10.1093/nar/gkab944 | Contact: Lukasz P. Kozlowski |
