Streptomyces sp. WAC00469
Taxonomy: cellular organisms; Bacteria; Terrabacteria group; Actinobacteria; Actinomycetia; Streptomycetales; Streptomycetaceae; Streptomyces; unclassified Streptomyces
Average proteome isoelectric point is 6.59
Get precalculated fractions of proteins
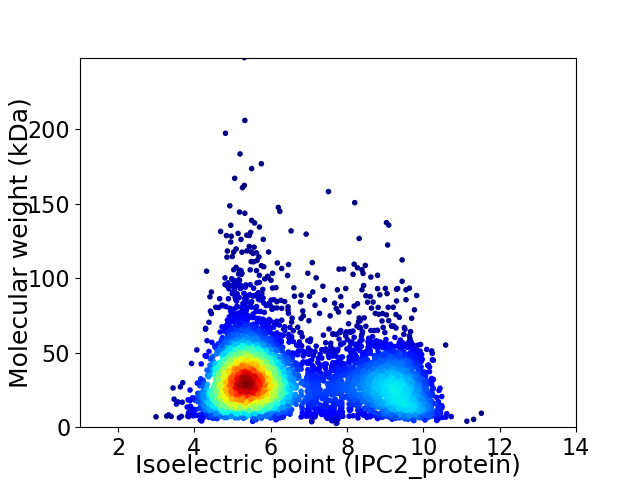
Virtual 2D-PAGE plot for 5069 proteins (isoelectric point calculated using IPC2_protein)
Get csv file with sequences according to given criteria:
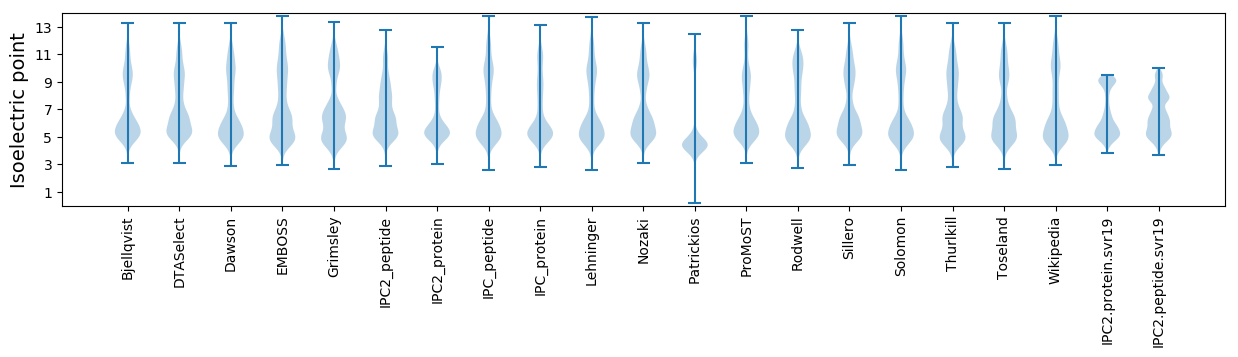
* You can choose from 21 different methods for calculating isoelectric point
Summary statistics related to proteome-wise predictions
Protein with the lowest isoelectric point:
>tr|A0A429N9R0|A0A429N9R0_9ACTN Glucanase OS=Streptomyces sp. WAC00469 OX=2487415 GN=EF917_14505 PE=3 SV=1
MM1 pKa = 7.87AEE3 pKa = 3.61QTYY6 pKa = 8.2TVSGMSCGHH15 pKa = 6.6CAASITEE22 pKa = 4.31EE23 pKa = 4.22VVEE26 pKa = 4.52VPGVTDD32 pKa = 3.12VDD34 pKa = 3.66VDD36 pKa = 4.17VPAGLVTVRR45 pKa = 11.84GEE47 pKa = 4.32SVDD50 pKa = 3.5ADD52 pKa = 3.57AVRR55 pKa = 11.84AAIVEE60 pKa = 3.99AGYY63 pKa = 10.71EE64 pKa = 4.24VTEE67 pKa = 4.42SMRR70 pKa = 11.84STVAA74 pKa = 3.13
MM1 pKa = 7.87AEE3 pKa = 3.61QTYY6 pKa = 8.2TVSGMSCGHH15 pKa = 6.6CAASITEE22 pKa = 4.31EE23 pKa = 4.22VVEE26 pKa = 4.52VPGVTDD32 pKa = 3.12VDD34 pKa = 3.66VDD36 pKa = 4.17VPAGLVTVRR45 pKa = 11.84GEE47 pKa = 4.32SVDD50 pKa = 3.5ADD52 pKa = 3.57AVRR55 pKa = 11.84AAIVEE60 pKa = 3.99AGYY63 pKa = 10.71EE64 pKa = 4.24VTEE67 pKa = 4.42SMRR70 pKa = 11.84STVAA74 pKa = 3.13
Molecular weight: 7.59 kDa
Isoelectric point according different methods:
Protein with the highest isoelectric point:
>tr|A0A3R9STD6|A0A3R9STD6_9ACTN Ribonuclease 3 OS=Streptomyces sp. WAC00469 OX=2487415 GN=rnc PE=3 SV=1
MM1 pKa = 7.69SKK3 pKa = 9.0RR4 pKa = 11.84TFQPNNRR11 pKa = 11.84RR12 pKa = 11.84RR13 pKa = 11.84AKK15 pKa = 8.7THH17 pKa = 5.15GFRR20 pKa = 11.84LRR22 pKa = 11.84MRR24 pKa = 11.84TRR26 pKa = 11.84AGRR29 pKa = 11.84AILASRR35 pKa = 11.84RR36 pKa = 11.84SKK38 pKa = 10.75GRR40 pKa = 11.84ARR42 pKa = 11.84LSAA45 pKa = 3.91
MM1 pKa = 7.69SKK3 pKa = 9.0RR4 pKa = 11.84TFQPNNRR11 pKa = 11.84RR12 pKa = 11.84RR13 pKa = 11.84AKK15 pKa = 8.7THH17 pKa = 5.15GFRR20 pKa = 11.84LRR22 pKa = 11.84MRR24 pKa = 11.84TRR26 pKa = 11.84AGRR29 pKa = 11.84AILASRR35 pKa = 11.84RR36 pKa = 11.84SKK38 pKa = 10.75GRR40 pKa = 11.84ARR42 pKa = 11.84LSAA45 pKa = 3.91
Molecular weight: 5.28 kDa
Isoelectric point according different methods:
Peptides (in silico digests for buttom-up proteomics)
Below you can find in silico digests of the whole proteome with Trypsin, Chymotrypsin, Trypsin+LysC, LysN, ArgC proteases suitable for different mass spec machines.| Try ESI |
 |
|---|
| ChTry ESI |
|
|---|
| ArgC ESI |
|
|---|
| LysN ESI |
|
|---|
| TryLysC ESI |
|
|---|
| Try MALDI |
|
|---|
| ChTry MALDI |
|
|---|
| ArgC MALDI |
|
|---|
| LysN MALDI |
|
|---|
| TryLysC MALDI |
|
|---|
| Try LTQ |
|
|---|
| ChTry LTQ |
|
|---|
| ArgC LTQ |
|
|---|
| LysN LTQ |
|
|---|
| TryLysC LTQ |
|
|---|
| Try MSlow |
|
|---|
| ChTry MSlow |
|
|---|
| ArgC MSlow |
|
|---|
| LysN MSlow |
|
|---|
| TryLysC MSlow |
|
|---|
| Try MShigh |
|
|---|
| ChTry MShigh |
|
|---|
| ArgC MShigh |
|
|---|
| LysN MShigh |
|
|---|
| TryLysC MShigh |
|
|---|
General Statistics
Number of major isoforms |
Number of additional isoforms |
Number of all proteins |
Number of amino acids |
Min. Seq. Length |
Max. Seq. Length |
Avg. Seq. Length |
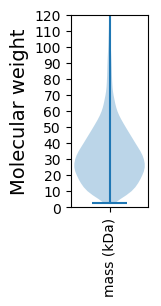
Avg. Mol. Weight |
|---|---|---|---|---|---|---|---|
0 |
1630969 |
24 |
2240 |
321.8 |
34.52 |
Amino acid frequency
Ala |
Cys |
Asp |
Glu |
Phe |
Gly |
His |
Ile |
Lys |
Leu |
|---|---|---|---|---|---|---|---|---|---|
13.642 ± 0.051 | 0.845 ± 0.009 |
6.044 ± 0.029 | 5.687 ± 0.039 |
2.62 ± 0.018 | 9.315 ± 0.036 |
2.408 ± 0.016 | 3.059 ± 0.025 |
2.117 ± 0.026 | 10.265 ± 0.039 |
Met |
Asn |
Gln |
Pro |
Arg |
Ser |
Thr |
Val |
Trp |
Tyr |
|---|---|---|---|---|---|---|---|---|---|
1.659 ± 0.013 | 1.613 ± 0.016 |
6.236 ± 0.032 | 2.871 ± 0.021 |
8.539 ± 0.041 | 4.755 ± 0.023 |
6.155 ± 0.029 | 8.661 ± 0.038 |
1.465 ± 0.014 | 2.044 ± 0.016 |
Most of the basic statistics you can see at this page can be downloaded from this CSV file
See this proteome in:

Proteome-pI is available under Creative Commons Attribution-NoDerivs license, for more details see here
| Reference: Kozlowski LP. Proteome-pI 2.0: Proteome Isoelectric Point Database Update. Nucleic Acids Res. 2021, doi: 10.1093/nar/gkab944 | Contact: Lukasz P. Kozlowski |