Striga asiatica (Asiatic witchweed) (Buchnera asiatica)
Taxonomy: cellular organisms; Eukaryota; Viridiplantae; Streptophyta; Streptophytina; Embryophyta; Tracheophyta; Euphyllophyta; Spermatophyta; Magnoliopsida; Mesangiospermae; eudicotyledons; Gunneridae; Pentapetalae; asterids; lamiids; Lamiales; Orobanchaceae; Buchnereae; Striga
Average proteome isoelectric point is 7.09
Get precalculated fractions of proteins

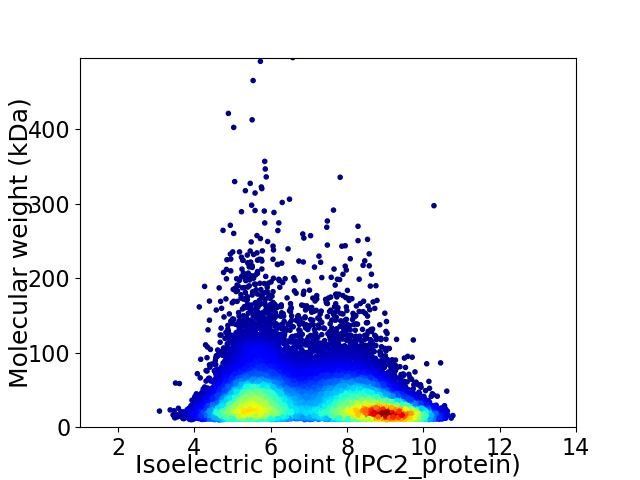
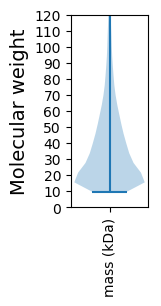
Virtual 2D-PAGE plot for 33322 proteins (isoelectric point calculated using IPC2_protein)
Get csv file with sequences according to given criteria:
* You can choose from 21 different methods for calculating isoelectric point
Summary statistics related to proteome-wise predictions


Protein with the lowest isoelectric point:
>tr|A0A5A7PX02|A0A5A7PX02_STRAF ABC-type multidrug transport system OS=Striga asiatica OX=4170 GN=STAS_13778 PE=4 SV=1
MM1 pKa = 7.08QGVVLDD7 pKa = 4.43RR8 pKa = 11.84SMLDD12 pKa = 3.37SLYY15 pKa = 10.98DD16 pKa = 3.66AAMTQNNTNGTSLQMAGVPSNNPFEE41 pKa = 5.62SDD43 pKa = 3.8DD44 pKa = 3.91YY45 pKa = 9.29STQMFYY51 pKa = 11.18DD52 pKa = 4.47PSQPNQLQLAEE63 pKa = 4.89IPQQQQTQQMIGYY76 pKa = 9.18DD77 pKa = 3.78YY78 pKa = 10.31KK79 pKa = 11.03QVIGIPQQQQEE90 pKa = 4.4TSLVVYY96 pKa = 10.18DD97 pKa = 4.74SNQQQEE103 pKa = 3.94QSFVNKK109 pKa = 10.34NLMQMTDD116 pKa = 3.55TPLEE120 pKa = 4.13TPMQQQEE127 pKa = 4.15KK128 pKa = 9.34PIVAFEE134 pKa = 3.93PMGNSRR140 pKa = 11.84NPFDD144 pKa = 3.58
MM1 pKa = 7.08QGVVLDD7 pKa = 4.43RR8 pKa = 11.84SMLDD12 pKa = 3.37SLYY15 pKa = 10.98DD16 pKa = 3.66AAMTQNNTNGTSLQMAGVPSNNPFEE41 pKa = 5.62SDD43 pKa = 3.8DD44 pKa = 3.91YY45 pKa = 9.29STQMFYY51 pKa = 11.18DD52 pKa = 4.47PSQPNQLQLAEE63 pKa = 4.89IPQQQQTQQMIGYY76 pKa = 9.18DD77 pKa = 3.78YY78 pKa = 10.31KK79 pKa = 11.03QVIGIPQQQQEE90 pKa = 4.4TSLVVYY96 pKa = 10.18DD97 pKa = 4.74SNQQQEE103 pKa = 3.94QSFVNKK109 pKa = 10.34NLMQMTDD116 pKa = 3.55TPLEE120 pKa = 4.13TPMQQQEE127 pKa = 4.15KK128 pKa = 9.34PIVAFEE134 pKa = 3.93PMGNSRR140 pKa = 11.84NPFDD144 pKa = 3.58
Molecular weight: 16.39 kDa
Isoelectric point according different methods:
Protein with the highest isoelectric point:
>tr|A0A5A7NZI8|A0A5A7NZI8_STRAF NAD(P)-binding Rossmann-fold superfamily protein OS=Striga asiatica OX=4170 GN=STAS_01571 PE=4 SV=1
MM1 pKa = 7.97KK2 pKa = 10.05IRR4 pKa = 11.84ASVRR8 pKa = 11.84KK9 pKa = 8.91ICKK12 pKa = 8.34KK13 pKa = 9.8CRR15 pKa = 11.84LIRR18 pKa = 11.84RR19 pKa = 11.84RR20 pKa = 11.84GRR22 pKa = 11.84IINMTKK28 pKa = 9.96ARR30 pKa = 11.84PRR32 pKa = 11.84TGSRR36 pKa = 11.84RR37 pKa = 11.84NVRR40 pKa = 11.84IGSRR44 pKa = 11.84RR45 pKa = 11.84IVRR48 pKa = 11.84IGSRR52 pKa = 11.84RR53 pKa = 11.84KK54 pKa = 9.7VRR56 pKa = 11.84IISRR60 pKa = 11.84KK61 pKa = 6.11STHH64 pKa = 7.22RR65 pKa = 11.84IPKK68 pKa = 9.97GLIHH72 pKa = 5.96VQSSFNNTIVTVTDD86 pKa = 3.22LRR88 pKa = 11.84GRR90 pKa = 11.84VLSWSSAGTLGFKK103 pKa = 10.4GPRR106 pKa = 11.84KK107 pKa = 8.48RR108 pKa = 11.84TPFAAQTTAADD119 pKa = 4.99AIRR122 pKa = 11.84TVVDD126 pKa = 2.88QGMQRR131 pKa = 11.84AAVMLKK137 pKa = 10.43GAA139 pKa = 4.54
MM1 pKa = 7.97KK2 pKa = 10.05IRR4 pKa = 11.84ASVRR8 pKa = 11.84KK9 pKa = 8.91ICKK12 pKa = 8.34KK13 pKa = 9.8CRR15 pKa = 11.84LIRR18 pKa = 11.84RR19 pKa = 11.84RR20 pKa = 11.84GRR22 pKa = 11.84IINMTKK28 pKa = 9.96ARR30 pKa = 11.84PRR32 pKa = 11.84TGSRR36 pKa = 11.84RR37 pKa = 11.84NVRR40 pKa = 11.84IGSRR44 pKa = 11.84RR45 pKa = 11.84IVRR48 pKa = 11.84IGSRR52 pKa = 11.84RR53 pKa = 11.84KK54 pKa = 9.7VRR56 pKa = 11.84IISRR60 pKa = 11.84KK61 pKa = 6.11STHH64 pKa = 7.22RR65 pKa = 11.84IPKK68 pKa = 9.97GLIHH72 pKa = 5.96VQSSFNNTIVTVTDD86 pKa = 3.22LRR88 pKa = 11.84GRR90 pKa = 11.84VLSWSSAGTLGFKK103 pKa = 10.4GPRR106 pKa = 11.84KK107 pKa = 8.48RR108 pKa = 11.84TPFAAQTTAADD119 pKa = 4.99AIRR122 pKa = 11.84TVVDD126 pKa = 2.88QGMQRR131 pKa = 11.84AAVMLKK137 pKa = 10.43GAA139 pKa = 4.54
Molecular weight: 15.66 kDa
Isoelectric point according different methods:
Peptides (in silico digests for buttom-up proteomics)
Below you can find in silico digests of the whole proteome with Trypsin, Chymotrypsin, Trypsin+LysC, LysN, ArgC proteases suitable for different mass spec machines.| Try ESI |
 |
|---|
| ChTry ESI |
 |
|---|
| ArgC ESI |
 |
|---|
| LysN ESI |
 |
|---|
| TryLysC ESI |
 |
|---|
| Try MALDI |
 |
|---|
| ChTry MALDI |
 |
|---|
| ArgC MALDI |
 |
|---|
| LysN MALDI |
 |
|---|
| TryLysC MALDI |
 |
|---|
| Try LTQ |
 |
|---|
| ChTry LTQ |
 |
|---|
| ArgC LTQ |
 |
|---|
| LysN LTQ |
 |
|---|
| TryLysC LTQ |
 |
|---|
| Try MSlow |
 |
|---|
| ChTry MSlow |
 |
|---|
| ArgC MSlow |
 |
|---|
| LysN MSlow |
 |
|---|
| TryLysC MSlow |
 |
|---|
| Try MShigh |
 |
|---|
| ChTry MShigh |
 |
|---|
| ArgC MShigh |
 |
|---|
| LysN MShigh |
 |
|---|
| TryLysC MShigh |
 |
|---|
General Statistics
Number of major isoforms |
Number of additional isoforms |
Number of all proteins |
Number of amino acids |
Min. Seq. Length |
Max. Seq. Length |
Avg. Seq. Length |
Avg. Mol. Weight |
|---|---|---|---|---|---|---|---|
0 |
12314773 |
99 |
5358 |
369.6 |
41.23 |
Amino acid frequency
Ala |
Cys |
Asp |
Glu |
Phe |
Gly |
His |
Ile |
Lys |
Leu |
|---|---|---|---|---|---|---|---|---|---|
6.916 ± 0.013 | 1.897 ± 0.006 |
5.242 ± 0.009 | 6.406 ± 0.013 |
4.191 ± 0.009 | 6.737 ± 0.013 |
2.421 ± 0.006 | 5.108 ± 0.009 |
5.916 ± 0.012 | 9.577 ± 0.016 |
Met |
Asn |
Gln |
Pro |
Arg |
Ser |
Thr |
Val |
Trp |
Tyr |
|---|---|---|---|---|---|---|---|---|---|
2.316 ± 0.005 | 4.363 ± 0.009 |
5.24 ± 0.013 | 3.422 ± 0.01 |
6.012 ± 0.011 | 8.831 ± 0.013 |
4.793 ± 0.008 | 6.606 ± 0.01 |
1.325 ± 0.005 | 2.676 ± 0.008 |
Most of the basic statistics you can see at this page can be downloaded from this CSV file
Proteome-pI is available under Creative Commons Attribution-NoDerivs license, for more details see here
| Reference: Kozlowski LP. Proteome-pI 2.0: Proteome Isoelectric Point Database Update. Nucleic Acids Res. 2021, doi: 10.1093/nar/gkab944 | Contact: Lukasz P. Kozlowski |
