Sulfolobus sp. F3
Taxonomy: cellular organisms; Archaea; TACK group; Crenarchaeota; Thermoprotei; Sulfolobales; Sulfolobaceae; Sulfolobus; unclassified Sulfolobus
Average proteome isoelectric point is 6.88
Get precalculated fractions of proteins

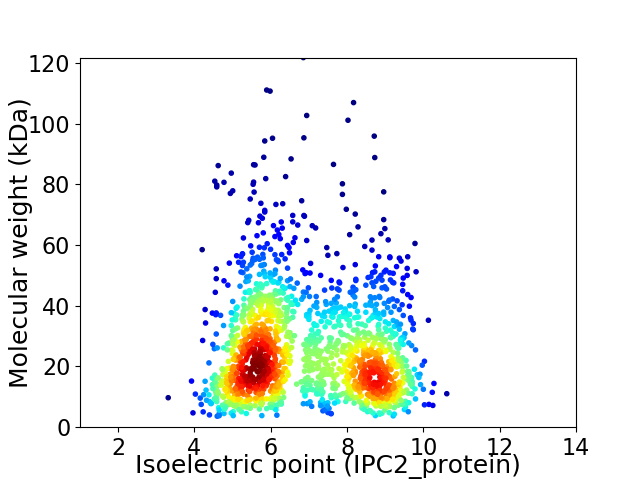
Virtual 2D-PAGE plot for 1702 proteins (isoelectric point calculated using IPC2_protein)
Get csv file with sequences according to given criteria:
* You can choose from 21 different methods for calculating isoelectric point
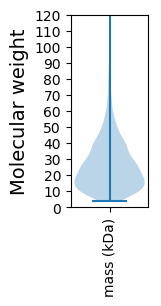
Summary statistics related to proteome-wise predictions


Protein with the lowest isoelectric point:
>tr|A0A550D2Q0|A0A550D2Q0_9CREN Uncharacterized protein (Fragment) OS=Sulfolobus sp. F3 OX=2200886 GN=DJ522_05725 PE=4 SV=1
MM1 pKa = 7.95DD2 pKa = 4.13NAVTEE7 pKa = 4.47FVLVVVTILIGLVLFSLVSSYY28 pKa = 9.03STYY31 pKa = 10.32QVSNYY36 pKa = 10.19AVLSEE41 pKa = 4.17AQQIAYY47 pKa = 9.38NLKK50 pKa = 9.28IDD52 pKa = 3.97IVTLEE57 pKa = 4.59DD58 pKa = 4.74GYY60 pKa = 9.47TLIVPYY66 pKa = 10.23SYY68 pKa = 11.32SSYY71 pKa = 11.17NGSLYY76 pKa = 9.95LTVFQAPAYY85 pKa = 9.74LINSSNLLNPTMPGISYY102 pKa = 7.71VTIYY106 pKa = 11.07NSTSGNQISFIQLDD120 pKa = 3.53GRR122 pKa = 11.84IYY124 pKa = 10.83SLSNQQLPSPLSVII138 pKa = 4.24
MM1 pKa = 7.95DD2 pKa = 4.13NAVTEE7 pKa = 4.47FVLVVVTILIGLVLFSLVSSYY28 pKa = 9.03STYY31 pKa = 10.32QVSNYY36 pKa = 10.19AVLSEE41 pKa = 4.17AQQIAYY47 pKa = 9.38NLKK50 pKa = 9.28IDD52 pKa = 3.97IVTLEE57 pKa = 4.59DD58 pKa = 4.74GYY60 pKa = 9.47TLIVPYY66 pKa = 10.23SYY68 pKa = 11.32SSYY71 pKa = 11.17NGSLYY76 pKa = 9.95LTVFQAPAYY85 pKa = 9.74LINSSNLLNPTMPGISYY102 pKa = 7.71VTIYY106 pKa = 11.07NSTSGNQISFIQLDD120 pKa = 3.53GRR122 pKa = 11.84IYY124 pKa = 10.83SLSNQQLPSPLSVII138 pKa = 4.24
Molecular weight: 15.19 kDa
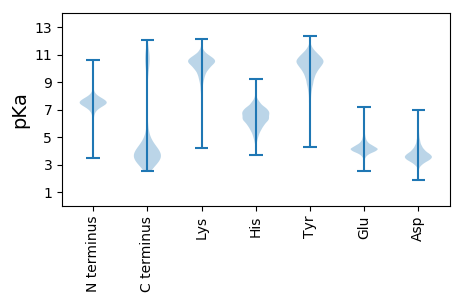
Isoelectric point according different methods:
Protein with the highest isoelectric point:
>tr|A0A550D533|A0A550D533_9CREN Uncharacterized protein (Fragment) OS=Sulfolobus sp. F3 OX=2200886 GN=DJ522_01325 PE=4 SV=1
MM1 pKa = 7.56SFNKK5 pKa = 9.82FLSLFSLNRR14 pKa = 11.84SKK16 pKa = 9.92TKK18 pKa = 10.06RR19 pKa = 11.84KK20 pKa = 9.33PFFTVRR26 pKa = 11.84DD27 pKa = 3.5KK28 pKa = 11.76AEE30 pKa = 3.71QRR32 pKa = 11.84GVKK35 pKa = 10.47GNLQTVAQISFPLFLSPLLVINRR58 pKa = 11.84KK59 pKa = 8.02EE60 pKa = 4.39FILLCNPRR68 pKa = 11.84PKK70 pKa = 10.58GRR72 pKa = 11.84EE73 pKa = 3.61FHH75 pKa = 6.91HH76 pKa = 6.81LCKK79 pKa = 9.85PWVGFEE85 pKa = 4.39PGPLPYY91 pKa = 10.51QIDD94 pKa = 3.85RR95 pKa = 11.84QNINYY100 pKa = 8.79IRR102 pKa = 11.84EE103 pKa = 4.13LMSEE107 pKa = 4.45DD108 pKa = 2.73IHH110 pKa = 6.61RR111 pKa = 11.84HH112 pKa = 3.71SRR114 pKa = 11.84EE115 pKa = 3.56TRR117 pKa = 11.84KK118 pKa = 10.06RR119 pKa = 3.4
MM1 pKa = 7.56SFNKK5 pKa = 9.82FLSLFSLNRR14 pKa = 11.84SKK16 pKa = 9.92TKK18 pKa = 10.06RR19 pKa = 11.84KK20 pKa = 9.33PFFTVRR26 pKa = 11.84DD27 pKa = 3.5KK28 pKa = 11.76AEE30 pKa = 3.71QRR32 pKa = 11.84GVKK35 pKa = 10.47GNLQTVAQISFPLFLSPLLVINRR58 pKa = 11.84KK59 pKa = 8.02EE60 pKa = 4.39FILLCNPRR68 pKa = 11.84PKK70 pKa = 10.58GRR72 pKa = 11.84EE73 pKa = 3.61FHH75 pKa = 6.91HH76 pKa = 6.81LCKK79 pKa = 9.85PWVGFEE85 pKa = 4.39PGPLPYY91 pKa = 10.51QIDD94 pKa = 3.85RR95 pKa = 11.84QNINYY100 pKa = 8.79IRR102 pKa = 11.84EE103 pKa = 4.13LMSEE107 pKa = 4.45DD108 pKa = 2.73IHH110 pKa = 6.61RR111 pKa = 11.84HH112 pKa = 3.71SRR114 pKa = 11.84EE115 pKa = 3.56TRR117 pKa = 11.84KK118 pKa = 10.06RR119 pKa = 3.4
Molecular weight: 14.18 kDa
Isoelectric point according different methods:
Peptides (in silico digests for buttom-up proteomics)
Below you can find in silico digests of the whole proteome with Trypsin, Chymotrypsin, Trypsin+LysC, LysN, ArgC proteases suitable for different mass spec machines.| Try ESI |
 |
|---|
| ChTry ESI |
 |
|---|
| ArgC ESI |
 |
|---|
| LysN ESI |
 |
|---|
| TryLysC ESI |
 |
|---|
| Try MALDI |
 |
|---|
| ChTry MALDI |
 |
|---|
| ArgC MALDI |
 |
|---|
| LysN MALDI |
 |
|---|
| TryLysC MALDI |
 |
|---|
| Try LTQ |
 |
|---|
| ChTry LTQ |
 |
|---|
| ArgC LTQ |
 |
|---|
| LysN LTQ |
 |
|---|
| TryLysC LTQ |
 |
|---|
| Try MSlow |
 |
|---|
| ChTry MSlow |
 |
|---|
| ArgC MSlow |
 |
|---|
| LysN MSlow |
 |
|---|
| TryLysC MSlow |
 |
|---|
| Try MShigh |
 |
|---|
| ChTry MShigh |
 |
|---|
| ArgC MShigh |
 |
|---|
| LysN MShigh |
 |
|---|
| TryLysC MShigh |
 |
|---|
General Statistics
Number of major isoforms |
Number of additional isoforms |
Number of all proteins |
Number of amino acids |
Min. Seq. Length |
Max. Seq. Length |
Avg. Seq. Length |
Avg. Mol. Weight |
|---|---|---|---|---|---|---|---|
0 |
403996 |
31 |
1050 |
237.4 |
26.82 |
Amino acid frequency
Ala |
Cys |
Asp |
Glu |
Phe |
Gly |
His |
Ile |
Lys |
Leu |
|---|---|---|---|---|---|---|---|---|---|
5.584 ± 0.06 | 0.626 ± 0.02 |
4.866 ± 0.047 | 6.762 ± 0.074 |
4.41 ± 0.049 | 6.639 ± 0.052 |
1.307 ± 0.022 | 9.8 ± 0.074 |
7.544 ± 0.071 | 10.208 ± 0.081 |
Met |
Asn |
Gln |
Pro |
Arg |
Ser |
Thr |
Val |
Trp |
Tyr |
|---|---|---|---|---|---|---|---|---|---|
2.213 ± 0.024 | 5.028 ± 0.053 |
3.941 ± 0.045 | 2.025 ± 0.034 |
4.365 ± 0.049 | 6.835 ± 0.048 |
4.549 ± 0.052 | 7.484 ± 0.056 |
1.046 ± 0.022 | 4.769 ± 0.047 |
Most of the basic statistics you can see at this page can be downloaded from this CSV file
Proteome-pI is available under Creative Commons Attribution-NoDerivs license, for more details see here
| Reference: Kozlowski LP. Proteome-pI 2.0: Proteome Isoelectric Point Database Update. Nucleic Acids Res. 2021, doi: 10.1093/nar/gkab944 | Contact: Lukasz P. Kozlowski |
