Candidatus Phycosocius bacilliformis
Taxonomy: cellular organisms; Bacteria; Proteobacteria; Alphaproteobacteria; Alphaproteobacteria incertae sedis; Candidatus Phycosocius
Average proteome isoelectric point is 6.58
Get precalculated fractions of proteins

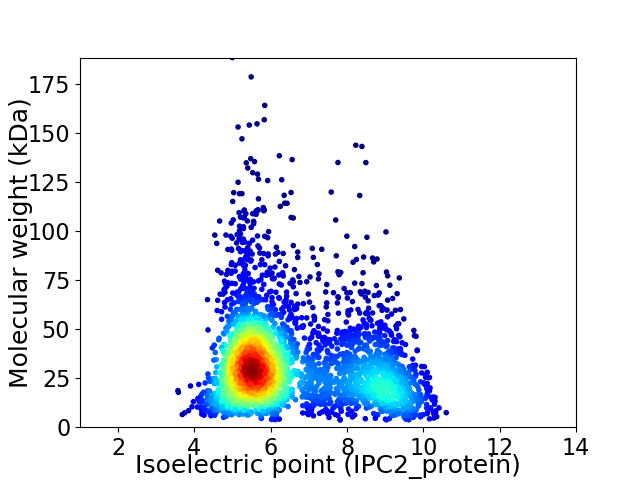
Virtual 2D-PAGE plot for 3121 proteins (isoelectric point calculated using IPC2_protein)
Get csv file with sequences according to given criteria:
* You can choose from 21 different methods for calculating isoelectric point
Summary statistics related to proteome-wise predictions


Protein with the lowest isoelectric point:
>tr|A0A2P2EDJ2|A0A2P2EDJ2_9PROT Uncharacterized protein OS=Candidatus Phycosocius bacilliformis OX=1445552 GN=PbB2_02819 PE=4 SV=1
MM1 pKa = 7.17SQEE4 pKa = 4.09QSNQAYY10 pKa = 9.49YY11 pKa = 10.91AGRR14 pKa = 11.84TDD16 pKa = 3.19AFNGVGQQTIADD28 pKa = 3.76QSSNLQTDD36 pKa = 3.57YY37 pKa = 11.58DD38 pKa = 3.55QGYY41 pKa = 9.78RR42 pKa = 11.84DD43 pKa = 4.1ANSEE47 pKa = 3.95IKK49 pKa = 10.47LDD51 pKa = 5.24QDD53 pKa = 4.31TEE55 pKa = 3.84WDD57 pKa = 3.32
MM1 pKa = 7.17SQEE4 pKa = 4.09QSNQAYY10 pKa = 9.49YY11 pKa = 10.91AGRR14 pKa = 11.84TDD16 pKa = 3.19AFNGVGQQTIADD28 pKa = 3.76QSSNLQTDD36 pKa = 3.57YY37 pKa = 11.58DD38 pKa = 3.55QGYY41 pKa = 9.78RR42 pKa = 11.84DD43 pKa = 4.1ANSEE47 pKa = 3.95IKK49 pKa = 10.47LDD51 pKa = 5.24QDD53 pKa = 4.31TEE55 pKa = 3.84WDD57 pKa = 3.32
Molecular weight: 6.47 kDa
Isoelectric point according different methods:
Protein with the highest isoelectric point:
>tr|A0A2P2EDU5|A0A2P2EDU5_9PROT NAD(P) transhydrogenase subunit alpha part 1 OS=Candidatus Phycosocius bacilliformis OX=1445552 GN=pntAA PE=3 SV=1
MM1 pKa = 7.5GLACGCLTLSLALASPACAQSAKK24 pKa = 10.18RR25 pKa = 11.84GQEE28 pKa = 3.56LTFNDD33 pKa = 3.76MFEE36 pKa = 4.68SPNAAAPQAVAFAAGPNNLRR56 pKa = 11.84FVLDD60 pKa = 4.2RR61 pKa = 11.84SQPRR65 pKa = 11.84VVLLQFDD72 pKa = 4.3GDD74 pKa = 4.17PEE76 pKa = 4.31VWALTSSWGPRR87 pKa = 11.84GDD89 pKa = 3.2EE90 pKa = 4.45FLRR93 pKa = 11.84NDD95 pKa = 3.07IGEE98 pKa = 4.33VIVRR102 pKa = 11.84ITTLGGVTVYY112 pKa = 11.1GPLGTNGGLAASQGKK127 pKa = 9.65AKK129 pKa = 10.41SLPAPSRR136 pKa = 11.84SEE138 pKa = 3.81GTLQATLQKK147 pKa = 10.64ALRR150 pKa = 11.84WFDD153 pKa = 3.53RR154 pKa = 11.84FSSRR158 pKa = 11.84SIRR161 pKa = 11.84VEE163 pKa = 3.63ASGGLPPALVHH174 pKa = 6.23EE175 pKa = 4.62ALEE178 pKa = 4.36RR179 pKa = 11.84AAQGMSRR186 pKa = 11.84APRR189 pKa = 11.84GYY191 pKa = 9.62FGRR194 pKa = 11.84PEE196 pKa = 4.07RR197 pKa = 11.84KK198 pKa = 8.74VKK200 pKa = 10.68LIRR203 pKa = 11.84VQRR206 pKa = 11.84SFDD209 pKa = 3.52QPSVRR214 pKa = 11.84WQSGVLTIGVVPGAGYY230 pKa = 10.7AGRR233 pKa = 11.84PSSAAVLLALTRR245 pKa = 11.84SRR247 pKa = 4.21
MM1 pKa = 7.5GLACGCLTLSLALASPACAQSAKK24 pKa = 10.18RR25 pKa = 11.84GQEE28 pKa = 3.56LTFNDD33 pKa = 3.76MFEE36 pKa = 4.68SPNAAAPQAVAFAAGPNNLRR56 pKa = 11.84FVLDD60 pKa = 4.2RR61 pKa = 11.84SQPRR65 pKa = 11.84VVLLQFDD72 pKa = 4.3GDD74 pKa = 4.17PEE76 pKa = 4.31VWALTSSWGPRR87 pKa = 11.84GDD89 pKa = 3.2EE90 pKa = 4.45FLRR93 pKa = 11.84NDD95 pKa = 3.07IGEE98 pKa = 4.33VIVRR102 pKa = 11.84ITTLGGVTVYY112 pKa = 11.1GPLGTNGGLAASQGKK127 pKa = 9.65AKK129 pKa = 10.41SLPAPSRR136 pKa = 11.84SEE138 pKa = 3.81GTLQATLQKK147 pKa = 10.64ALRR150 pKa = 11.84WFDD153 pKa = 3.53RR154 pKa = 11.84FSSRR158 pKa = 11.84SIRR161 pKa = 11.84VEE163 pKa = 3.63ASGGLPPALVHH174 pKa = 6.23EE175 pKa = 4.62ALEE178 pKa = 4.36RR179 pKa = 11.84AAQGMSRR186 pKa = 11.84APRR189 pKa = 11.84GYY191 pKa = 9.62FGRR194 pKa = 11.84PEE196 pKa = 4.07RR197 pKa = 11.84KK198 pKa = 8.74VKK200 pKa = 10.68LIRR203 pKa = 11.84VQRR206 pKa = 11.84SFDD209 pKa = 3.52QPSVRR214 pKa = 11.84WQSGVLTIGVVPGAGYY230 pKa = 10.7AGRR233 pKa = 11.84PSSAAVLLALTRR245 pKa = 11.84SRR247 pKa = 4.21
Molecular weight: 26.24 kDa
Isoelectric point according different methods:
Peptides (in silico digests for buttom-up proteomics)
Below you can find in silico digests of the whole proteome with Trypsin, Chymotrypsin, Trypsin+LysC, LysN, ArgC proteases suitable for different mass spec machines.| Try ESI |
 |
|---|
| ChTry ESI |
 |
|---|
| ArgC ESI |
 |
|---|
| LysN ESI |
 |
|---|
| TryLysC ESI |
 |
|---|
| Try MALDI |
 |
|---|
| ChTry MALDI |
 |
|---|
| ArgC MALDI |
 |
|---|
| LysN MALDI |
 |
|---|
| TryLysC MALDI |
 |
|---|
| Try LTQ |
 |
|---|
| ChTry LTQ |
 |
|---|
| ArgC LTQ |
 |
|---|
| LysN LTQ |
 |
|---|
| TryLysC LTQ |
 |
|---|
| Try MSlow |
 |
|---|
| ChTry MSlow |
 |
|---|
| ArgC MSlow |
 |
|---|
| LysN MSlow |
 |
|---|
| TryLysC MSlow |
 |
|---|
| Try MShigh |
 |
|---|
| ChTry MShigh |
 |
|---|
| ArgC MShigh |
 |
|---|
| LysN MShigh |
 |
|---|
| TryLysC MShigh |
 |
|---|
General Statistics
Number of major isoforms |
Number of additional isoforms |
Number of all proteins |
Number of amino acids |
Min. Seq. Length |
Max. Seq. Length |
Avg. Seq. Length |
Avg. Mol. Weight |
|---|---|---|---|---|---|---|---|
0 |
996773 |
31 |
1742 |
319.4 |
34.54 |
Amino acid frequency
Ala |
Cys |
Asp |
Glu |
Phe |
Gly |
His |
Ile |
Lys |
Leu |
|---|---|---|---|---|---|---|---|---|---|
12.814 ± 0.071 | 0.862 ± 0.017 |
5.755 ± 0.031 | 5.173 ± 0.038 |
3.703 ± 0.026 | 8.56 ± 0.042 |
1.968 ± 0.023 | 5.151 ± 0.033 |
3.467 ± 0.033 | 10.06 ± 0.046 |
Met |
Asn |
Gln |
Pro |
Arg |
Ser |
Thr |
Val |
Trp |
Tyr |
|---|---|---|---|---|---|---|---|---|---|
2.412 ± 0.021 | 2.714 ± 0.03 |
5.394 ± 0.035 | 3.642 ± 0.027 |
6.733 ± 0.04 | 5.549 ± 0.031 |
5.405 ± 0.032 | 7.119 ± 0.039 |
1.417 ± 0.018 | 2.101 ± 0.021 |
Most of the basic statistics you can see at this page can be downloaded from this CSV file
Proteome-pI is available under Creative Commons Attribution-NoDerivs license, for more details see here
| Reference: Kozlowski LP. Proteome-pI 2.0: Proteome Isoelectric Point Database Update. Nucleic Acids Res. 2021, doi: 10.1093/nar/gkab944 | Contact: Lukasz P. Kozlowski |
