Sporothrix schenckii (strain ATCC 58251 / de Perez 2211183) (Rose-picker s disease fungus)
Taxonomy: cellular organisms; Eukaryota; Opisthokonta; Fungi; Dikarya; Ascomycota; saccharomyceta; Pezizomycotina; leotiomyceta; sordariomyceta; Sordariomycetes; Sordariomycetidae; Ophiostomatales; Ophiostomataceae; Sporothrix; Sporothrix schenckii
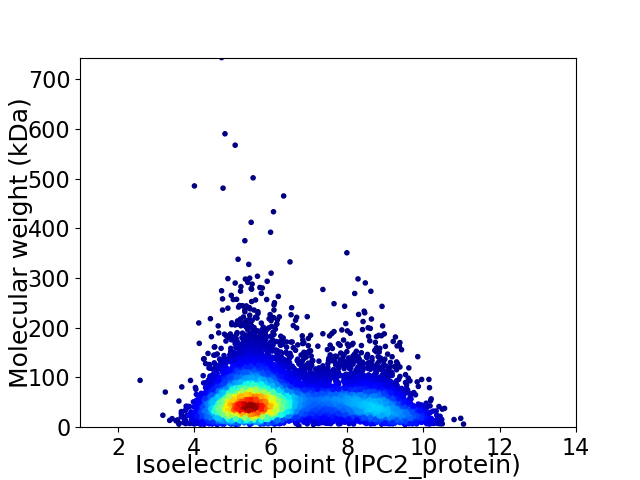
Average proteome isoelectric point is 6.41
Get precalculated fractions of proteins

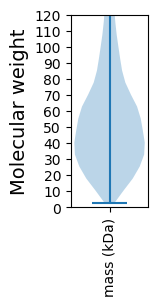
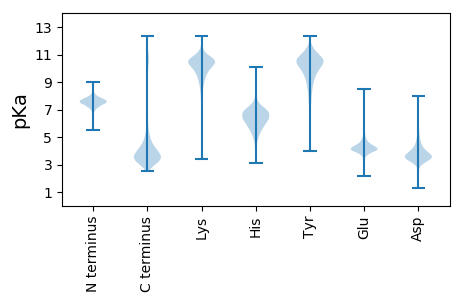
Virtual 2D-PAGE plot for 8673 proteins (isoelectric point calculated using IPC2_protein)
Get csv file with sequences according to given criteria:
* You can choose from 21 different methods for calculating isoelectric point
Summary statistics related to proteome-wise predictions


Protein with the lowest isoelectric point:
>tr|U7PNR3|U7PNR3_SPOS1 Uncharacterized protein OS=Sporothrix schenckii (strain ATCC 58251 / de Perez 2211183) OX=1391915 GN=HMPREF1624_06558 PE=4 SV=1
MM1 pKa = 8.1SYY3 pKa = 11.59GNDD6 pKa = 3.71NNDD9 pKa = 2.76SGYY12 pKa = 10.86GGNSGGFGGNNNDD25 pKa = 3.78DD26 pKa = 3.8SSFGGSGGRR35 pKa = 11.84GGRR38 pKa = 11.84NDD40 pKa = 3.93DD41 pKa = 3.71NSFGSSGNSGNSGSDD56 pKa = 3.01SYY58 pKa = 12.18GSGNSGSGGFGGSSGDD74 pKa = 3.66DD75 pKa = 3.45SYY77 pKa = 12.21GSSGNSGNRR86 pKa = 11.84SGRR89 pKa = 11.84GDD91 pKa = 3.78DD92 pKa = 4.3DD93 pKa = 5.56SYY95 pKa = 11.92GSSGNSGNRR104 pKa = 11.84GGRR107 pKa = 11.84GGDD110 pKa = 3.47DD111 pKa = 3.62SYY113 pKa = 12.06GSSGNSGNSGSGGFGGSSGDD133 pKa = 3.66DD134 pKa = 3.45SYY136 pKa = 12.21GSSGNSGSRR145 pKa = 11.84GGRR148 pKa = 11.84GGDD151 pKa = 3.49DD152 pKa = 3.62SYY154 pKa = 12.06GSSGNSGNSGSDD166 pKa = 3.01SYY168 pKa = 12.18GSGNSGSGGFGGSSGDD184 pKa = 3.66DD185 pKa = 3.45SYY187 pKa = 12.21GSSGNSGNRR196 pKa = 11.84GGRR199 pKa = 11.84GGDD202 pKa = 3.47DD203 pKa = 3.62SYY205 pKa = 11.99GSSGNTGSGGYY216 pKa = 9.84GGNNNDD222 pKa = 4.38NNDD225 pKa = 3.26SNYY228 pKa = 11.1
MM1 pKa = 8.1SYY3 pKa = 11.59GNDD6 pKa = 3.71NNDD9 pKa = 2.76SGYY12 pKa = 10.86GGNSGGFGGNNNDD25 pKa = 3.78DD26 pKa = 3.8SSFGGSGGRR35 pKa = 11.84GGRR38 pKa = 11.84NDD40 pKa = 3.93DD41 pKa = 3.71NSFGSSGNSGNSGSDD56 pKa = 3.01SYY58 pKa = 12.18GSGNSGSGGFGGSSGDD74 pKa = 3.66DD75 pKa = 3.45SYY77 pKa = 12.21GSSGNSGNRR86 pKa = 11.84SGRR89 pKa = 11.84GDD91 pKa = 3.78DD92 pKa = 4.3DD93 pKa = 5.56SYY95 pKa = 11.92GSSGNSGNRR104 pKa = 11.84GGRR107 pKa = 11.84GGDD110 pKa = 3.47DD111 pKa = 3.62SYY113 pKa = 12.06GSSGNSGNSGSGGFGGSSGDD133 pKa = 3.66DD134 pKa = 3.45SYY136 pKa = 12.21GSSGNSGSRR145 pKa = 11.84GGRR148 pKa = 11.84GGDD151 pKa = 3.49DD152 pKa = 3.62SYY154 pKa = 12.06GSSGNSGNSGSDD166 pKa = 3.01SYY168 pKa = 12.18GSGNSGSGGFGGSSGDD184 pKa = 3.66DD185 pKa = 3.45SYY187 pKa = 12.21GSSGNSGNRR196 pKa = 11.84GGRR199 pKa = 11.84GGDD202 pKa = 3.47DD203 pKa = 3.62SYY205 pKa = 11.99GSSGNTGSGGYY216 pKa = 9.84GGNNNDD222 pKa = 4.38NNDD225 pKa = 3.26SNYY228 pKa = 11.1
Molecular weight: 21.11 kDa
Isoelectric point according different methods:
Protein with the highest isoelectric point:
>tr|U7PP33|U7PP33_SPOS1 Uncharacterized protein OS=Sporothrix schenckii (strain ATCC 58251 / de Perez 2211183) OX=1391915 GN=HMPREF1624_07174 PE=4 SV=1
MM1 pKa = 7.3HH2 pKa = 7.26WHH4 pKa = 7.11HH5 pKa = 6.2STQTRR10 pKa = 11.84STGGILSPKK19 pKa = 8.99TRR21 pKa = 11.84TTRR24 pKa = 11.84TTHH27 pKa = 5.78RR28 pKa = 11.84HH29 pKa = 5.55HH30 pKa = 6.64GHH32 pKa = 6.82HH33 pKa = 6.46GHH35 pKa = 6.89HH36 pKa = 6.31SHH38 pKa = 6.92NGHH41 pKa = 5.01THH43 pKa = 5.01RR44 pKa = 11.84HH45 pKa = 4.76GLGLSTAGATTTTARR60 pKa = 11.84RR61 pKa = 11.84SPGTGLFHH69 pKa = 7.36RR70 pKa = 11.84RR71 pKa = 11.84VHH73 pKa = 5.25TPRR76 pKa = 11.84TKK78 pKa = 10.42VRR80 pKa = 11.84TARR83 pKa = 11.84TTTRR87 pKa = 11.84RR88 pKa = 11.84TGGGGGLFGTRR99 pKa = 11.84HH100 pKa = 5.2HH101 pKa = 6.0HH102 pKa = 5.29TKK104 pKa = 10.2RR105 pKa = 11.84SHH107 pKa = 5.42VLPVTTTTRR116 pKa = 11.84RR117 pKa = 11.84KK118 pKa = 7.93PTVGDD123 pKa = 4.01RR124 pKa = 11.84ISGAFHH130 pKa = 7.32KK131 pKa = 10.41IKK133 pKa = 10.66GSITGQPRR141 pKa = 11.84EE142 pKa = 3.95KK143 pKa = 10.71AIGDD147 pKa = 3.39RR148 pKa = 11.84RR149 pKa = 11.84MHH151 pKa = 5.28GTTRR155 pKa = 11.84RR156 pKa = 11.84RR157 pKa = 11.84RR158 pKa = 11.84WW159 pKa = 3.02
MM1 pKa = 7.3HH2 pKa = 7.26WHH4 pKa = 7.11HH5 pKa = 6.2STQTRR10 pKa = 11.84STGGILSPKK19 pKa = 8.99TRR21 pKa = 11.84TTRR24 pKa = 11.84TTHH27 pKa = 5.78RR28 pKa = 11.84HH29 pKa = 5.55HH30 pKa = 6.64GHH32 pKa = 6.82HH33 pKa = 6.46GHH35 pKa = 6.89HH36 pKa = 6.31SHH38 pKa = 6.92NGHH41 pKa = 5.01THH43 pKa = 5.01RR44 pKa = 11.84HH45 pKa = 4.76GLGLSTAGATTTTARR60 pKa = 11.84RR61 pKa = 11.84SPGTGLFHH69 pKa = 7.36RR70 pKa = 11.84RR71 pKa = 11.84VHH73 pKa = 5.25TPRR76 pKa = 11.84TKK78 pKa = 10.42VRR80 pKa = 11.84TARR83 pKa = 11.84TTTRR87 pKa = 11.84RR88 pKa = 11.84TGGGGGLFGTRR99 pKa = 11.84HH100 pKa = 5.2HH101 pKa = 6.0HH102 pKa = 5.29TKK104 pKa = 10.2RR105 pKa = 11.84SHH107 pKa = 5.42VLPVTTTTRR116 pKa = 11.84RR117 pKa = 11.84KK118 pKa = 7.93PTVGDD123 pKa = 4.01RR124 pKa = 11.84ISGAFHH130 pKa = 7.32KK131 pKa = 10.41IKK133 pKa = 10.66GSITGQPRR141 pKa = 11.84EE142 pKa = 3.95KK143 pKa = 10.71AIGDD147 pKa = 3.39RR148 pKa = 11.84RR149 pKa = 11.84MHH151 pKa = 5.28GTTRR155 pKa = 11.84RR156 pKa = 11.84RR157 pKa = 11.84RR158 pKa = 11.84WW159 pKa = 3.02
Molecular weight: 17.82 kDa
Isoelectric point according different methods:
Peptides (in silico digests for buttom-up proteomics)
Below you can find in silico digests of the whole proteome with Trypsin, Chymotrypsin, Trypsin+LysC, LysN, ArgC proteases suitable for different mass spec machines.| Try ESI |
 |
|---|
| ChTry ESI |
 |
|---|
| ArgC ESI |
 |
|---|
| LysN ESI |
 |
|---|
| TryLysC ESI |
 |
|---|
| Try MALDI |
 |
|---|
| ChTry MALDI |
 |
|---|
| ArgC MALDI |
 |
|---|
| LysN MALDI |
 |
|---|
| TryLysC MALDI |
 |
|---|
| Try LTQ |
 |
|---|
| ChTry LTQ |
 |
|---|
| ArgC LTQ |
 |
|---|
| LysN LTQ |
 |
|---|
| TryLysC LTQ |
 |
|---|
| Try MSlow |
 |
|---|
| ChTry MSlow |
 |
|---|
| ArgC MSlow |
 |
|---|
| LysN MSlow |
 |
|---|
| TryLysC MSlow |
 |
|---|
| Try MShigh |
 |
|---|
| ChTry MShigh |
 |
|---|
| ArgC MShigh |
 |
|---|
| LysN MShigh |
 |
|---|
| TryLysC MShigh |
 |
|---|
General Statistics
Number of major isoforms |
Number of additional isoforms |
Number of all proteins |
Number of amino acids |
Min. Seq. Length |
Max. Seq. Length |
Avg. Seq. Length |
Avg. Mol. Weight |
|---|---|---|---|---|---|---|---|
0 |
4783716 |
29 |
6939 |
551.6 |
59.85 |
Amino acid frequency
Ala |
Cys |
Asp |
Glu |
Phe |
Gly |
His |
Ile |
Lys |
Leu |
|---|---|---|---|---|---|---|---|---|---|
10.983 ± 0.034 | 1.013 ± 0.009 |
6.081 ± 0.021 | 5.302 ± 0.026 |
3.322 ± 0.014 | 7.64 ± 0.029 |
2.399 ± 0.011 | 3.892 ± 0.015 |
3.976 ± 0.02 | 8.398 ± 0.029 |
Met |
Asn |
Gln |
Pro |
Arg |
Ser |
Thr |
Val |
Trp |
Tyr |
|---|---|---|---|---|---|---|---|---|---|
2.05 ± 0.009 | 3.476 ± 0.015 |
6.362 ± 0.027 | 4.032 ± 0.025 |
6.29 ± 0.023 | 8.278 ± 0.036 |
6.277 ± 0.018 | 6.432 ± 0.019 |
1.276 ± 0.008 | 2.521 ± 0.013 |
Most of the basic statistics you can see at this page can be downloaded from this CSV file
Proteome-pI is available under Creative Commons Attribution-NoDerivs license, for more details see here
| Reference: Kozlowski LP. Proteome-pI 2.0: Proteome Isoelectric Point Database Update. Nucleic Acids Res. 2021, doi: 10.1093/nar/gkab944 | Contact: Lukasz P. Kozlowski |
