Arthrobacter phage Beans
Taxonomy: Viruses; Duplodnaviria; Heunggongvirae; Uroviricota; Caudoviricetes; Caudovirales; Myoviridae; Marthavirus; Arthrobacter virus Beans
Average proteome isoelectric point is 6.15
Get precalculated fractions of proteins

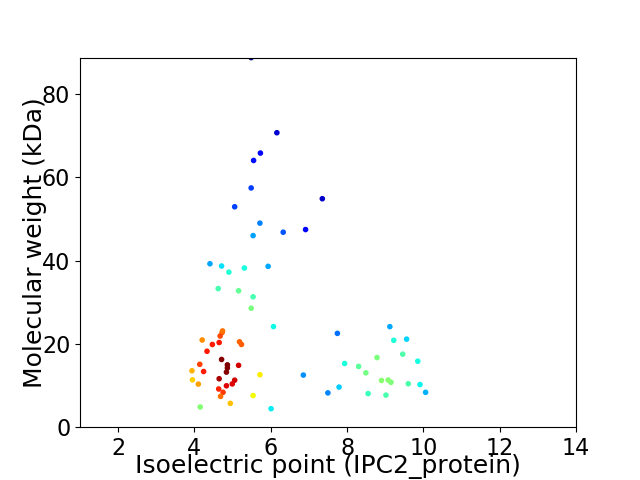
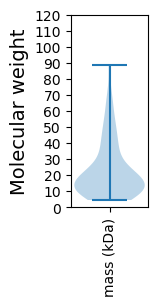
Virtual 2D-PAGE plot for 73 proteins (isoelectric point calculated using IPC2_protein)
Get csv file with sequences according to given criteria:
* You can choose from 21 different methods for calculating isoelectric point
Summary statistics related to proteome-wise predictions


Protein with the lowest isoelectric point:
>tr|A0A222ZJ07|A0A222ZJ07_9CAUD Uncharacterized protein OS=Arthrobacter phage Beans OX=2015815 GN=16 PE=4 SV=1
MM1 pKa = 7.89ADD3 pKa = 3.48GVLSFPFRR11 pKa = 11.84LDD13 pKa = 3.07TTGAIATVADD23 pKa = 4.2GSDD26 pKa = 3.26AYY28 pKa = 11.2VDD30 pKa = 3.2EE31 pKa = 5.93HH32 pKa = 6.36IAKK35 pKa = 10.28LVLTNIGEE43 pKa = 4.61CPMSPEE49 pKa = 4.09YY50 pKa = 10.59GVPDD54 pKa = 3.61PTFAALHH61 pKa = 6.3IGDD64 pKa = 4.04VQAGLSTFGPSGVRR78 pKa = 11.84VTAVEE83 pKa = 4.09MTPFSDD89 pKa = 3.77TQSVASIAWAYY100 pKa = 9.99EE101 pKa = 3.61NALGVTNNGG110 pKa = 3.22
MM1 pKa = 7.89ADD3 pKa = 3.48GVLSFPFRR11 pKa = 11.84LDD13 pKa = 3.07TTGAIATVADD23 pKa = 4.2GSDD26 pKa = 3.26AYY28 pKa = 11.2VDD30 pKa = 3.2EE31 pKa = 5.93HH32 pKa = 6.36IAKK35 pKa = 10.28LVLTNIGEE43 pKa = 4.61CPMSPEE49 pKa = 4.09YY50 pKa = 10.59GVPDD54 pKa = 3.61PTFAALHH61 pKa = 6.3IGDD64 pKa = 4.04VQAGLSTFGPSGVRR78 pKa = 11.84VTAVEE83 pKa = 4.09MTPFSDD89 pKa = 3.77TQSVASIAWAYY100 pKa = 9.99EE101 pKa = 3.61NALGVTNNGG110 pKa = 3.22
Molecular weight: 11.38 kDa
Isoelectric point according different methods:
Protein with the highest isoelectric point:
>tr|A0A222ZJY6|A0A222ZJY6_9CAUD Uncharacterized protein OS=Arthrobacter phage Beans OX=2015815 GN=51 PE=4 SV=1
MM1 pKa = 7.21TTPQNNPQAKK11 pKa = 8.68QRR13 pKa = 11.84KK14 pKa = 4.49TTQRR18 pKa = 11.84RR19 pKa = 11.84AAAGRR24 pKa = 11.84SAQKK28 pKa = 9.63PRR30 pKa = 11.84KK31 pKa = 8.57RR32 pKa = 11.84TALPKK37 pKa = 10.16AAPKK41 pKa = 10.07PLEE44 pKa = 4.37PLTALGPLWPDD55 pKa = 3.73PLPLEE60 pKa = 4.01YY61 pKa = 10.05HH62 pKa = 6.54AEE64 pKa = 3.83IEE66 pKa = 3.96IDD68 pKa = 3.4VRR70 pKa = 11.84LWDD73 pKa = 3.57WQKK76 pKa = 9.44TRR78 pKa = 11.84ISANDD83 pKa = 3.47RR84 pKa = 11.84LDD86 pKa = 3.49PRR88 pKa = 11.84EE89 pKa = 4.06KK90 pKa = 10.64NRR92 pKa = 11.84RR93 pKa = 11.84TQIWRR98 pKa = 11.84SAAEE102 pKa = 4.04AAVLAAGIDD111 pKa = 3.72PLSWARR117 pKa = 11.84VVYY120 pKa = 8.97WVRR123 pKa = 11.84WPDD126 pKa = 3.0NRR128 pKa = 11.84KK129 pKa = 9.69RR130 pKa = 11.84EE131 pKa = 4.11TSNLQPTAKK140 pKa = 10.31AIVDD144 pKa = 3.72GMVDD148 pKa = 3.93ARR150 pKa = 11.84VLPDD154 pKa = 4.64DD155 pKa = 4.36RR156 pKa = 11.84DD157 pKa = 3.71EE158 pKa = 4.54MVDD161 pKa = 3.56GPDD164 pKa = 3.63ARR166 pKa = 11.84RR167 pKa = 11.84IYY169 pKa = 10.48PNGPHH174 pKa = 6.57RR175 pKa = 11.84VIIQLWRR182 pKa = 11.84RR183 pKa = 11.84AA184 pKa = 3.44
MM1 pKa = 7.21TTPQNNPQAKK11 pKa = 8.68QRR13 pKa = 11.84KK14 pKa = 4.49TTQRR18 pKa = 11.84RR19 pKa = 11.84AAAGRR24 pKa = 11.84SAQKK28 pKa = 9.63PRR30 pKa = 11.84KK31 pKa = 8.57RR32 pKa = 11.84TALPKK37 pKa = 10.16AAPKK41 pKa = 10.07PLEE44 pKa = 4.37PLTALGPLWPDD55 pKa = 3.73PLPLEE60 pKa = 4.01YY61 pKa = 10.05HH62 pKa = 6.54AEE64 pKa = 3.83IEE66 pKa = 3.96IDD68 pKa = 3.4VRR70 pKa = 11.84LWDD73 pKa = 3.57WQKK76 pKa = 9.44TRR78 pKa = 11.84ISANDD83 pKa = 3.47RR84 pKa = 11.84LDD86 pKa = 3.49PRR88 pKa = 11.84EE89 pKa = 4.06KK90 pKa = 10.64NRR92 pKa = 11.84RR93 pKa = 11.84TQIWRR98 pKa = 11.84SAAEE102 pKa = 4.04AAVLAAGIDD111 pKa = 3.72PLSWARR117 pKa = 11.84VVYY120 pKa = 8.97WVRR123 pKa = 11.84WPDD126 pKa = 3.0NRR128 pKa = 11.84KK129 pKa = 9.69RR130 pKa = 11.84EE131 pKa = 4.11TSNLQPTAKK140 pKa = 10.31AIVDD144 pKa = 3.72GMVDD148 pKa = 3.93ARR150 pKa = 11.84VLPDD154 pKa = 4.64DD155 pKa = 4.36RR156 pKa = 11.84DD157 pKa = 3.71EE158 pKa = 4.54MVDD161 pKa = 3.56GPDD164 pKa = 3.63ARR166 pKa = 11.84RR167 pKa = 11.84IYY169 pKa = 10.48PNGPHH174 pKa = 6.57RR175 pKa = 11.84VIIQLWRR182 pKa = 11.84RR183 pKa = 11.84AA184 pKa = 3.44
Molecular weight: 21.15 kDa
Isoelectric point according different methods:
Peptides (in silico digests for buttom-up proteomics)
Below you can find in silico digests of the whole proteome with Trypsin, Chymotrypsin, Trypsin+LysC, LysN, ArgC proteases suitable for different mass spec machines.| Try ESI |
 |
|---|
| ChTry ESI |
 |
|---|
| ArgC ESI |
 |
|---|
| LysN ESI |
 |
|---|
| TryLysC ESI |
 |
|---|
| Try MALDI |
 |
|---|
| ChTry MALDI |
 |
|---|
| ArgC MALDI |
 |
|---|
| LysN MALDI |
 |
|---|
| TryLysC MALDI |
 |
|---|
| Try LTQ |
 |
|---|
| ChTry LTQ |
 |
|---|
| ArgC LTQ |
 |
|---|
| LysN LTQ |
 |
|---|
| TryLysC LTQ |
 |
|---|
| Try MSlow |
 |
|---|
| ChTry MSlow |
 |
|---|
| ArgC MSlow |
 |
|---|
| LysN MSlow |
 |
|---|
| TryLysC MSlow |
 |
|---|
| Try MShigh |
 |
|---|
| ChTry MShigh |
 |
|---|
| ArgC MShigh |
 |
|---|
| LysN MShigh |
 |
|---|
| TryLysC MShigh |
 |
|---|
General Statistics
Number of major isoforms |
Number of additional isoforms |
Number of all proteins |
Number of amino acids |
Min. Seq. Length |
Max. Seq. Length |
Avg. Seq. Length |
Avg. Mol. Weight |
|---|---|---|---|---|---|---|---|
0 |
15703 |
42 |
875 |
215.1 |
23.36 |
Amino acid frequency
Ala |
Cys |
Asp |
Glu |
Phe |
Gly |
His |
Ile |
Lys |
Leu |
|---|---|---|---|---|---|---|---|---|---|
12.367 ± 0.509 | 0.675 ± 0.092 |
6.196 ± 0.287 | 6.496 ± 0.397 |
2.764 ± 0.164 | 7.827 ± 0.386 |
1.618 ± 0.132 | 4.744 ± 0.229 |
4.286 ± 0.196 | 8.075 ± 0.313 |
Met |
Asn |
Gln |
Pro |
Arg |
Ser |
Thr |
Val |
Trp |
Tyr |
|---|---|---|---|---|---|---|---|---|---|
2.331 ± 0.158 | 3.324 ± 0.186 |
5.139 ± 0.32 | 3.611 ± 0.191 |
6.394 ± 0.334 | 5.566 ± 0.269 |
6.827 ± 0.349 | 7.788 ± 0.321 |
1.528 ± 0.153 | 2.445 ± 0.142 |
Most of the basic statistics you can see at this page can be downloaded from this CSV file
Proteome-pI is available under Creative Commons Attribution-NoDerivs license, for more details see here
| Reference: Kozlowski LP. Proteome-pI 2.0: Proteome Isoelectric Point Database Update. Nucleic Acids Res. 2021, doi: 10.1093/nar/gkab944 | Contact: Lukasz P. Kozlowski |
