Changjiang tombus-like virus 8
Taxonomy: Viruses; Riboviria; unclassified Riboviria; unclassified RNA viruses ShiM-2016
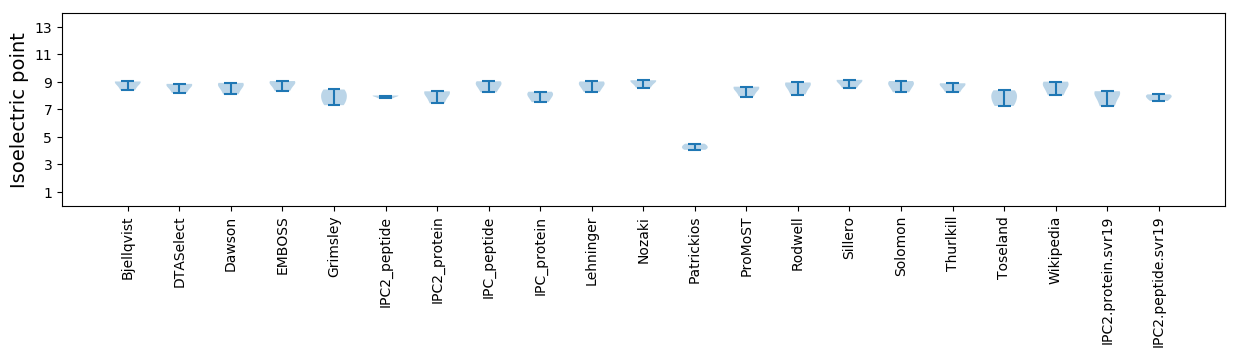
Average proteome isoelectric point is 7.91
Get precalculated fractions of proteins
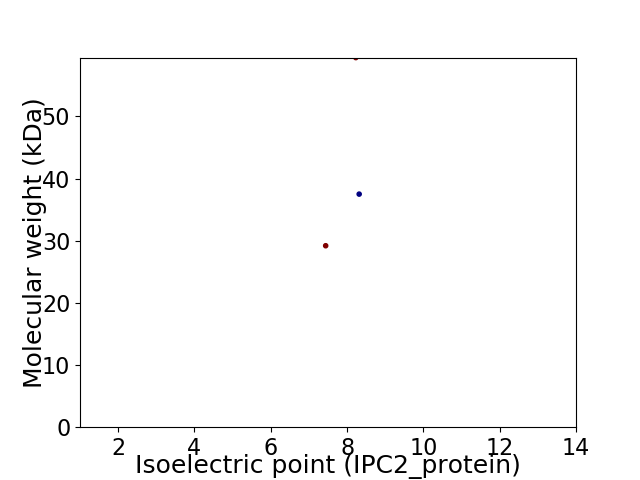
Virtual 2D-PAGE plot for 3 proteins (isoelectric point calculated using IPC2_protein)
Get csv file with sequences according to given criteria:
* You can choose from 21 different methods for calculating isoelectric point
Summary statistics related to proteome-wise predictions
Protein with the lowest isoelectric point:
>tr|A0A1L3KG20|A0A1L3KG20_9VIRU Capsid protein OS=Changjiang tombus-like virus 8 OX=1922822 PE=3 SV=1
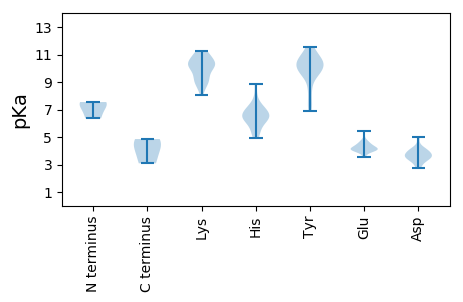
MM1 pKa = 6.36VTTRR5 pKa = 11.84ANSEE9 pKa = 4.09FLPVTRR15 pKa = 11.84LSQPDD20 pKa = 3.93DD21 pKa = 3.45QPYY24 pKa = 6.93WTFWDD29 pKa = 3.36RR30 pKa = 11.84WKK32 pKa = 11.26SSFAEE37 pKa = 4.54FWSTSTITRR46 pKa = 11.84MCCCVDD52 pKa = 3.69PEE54 pKa = 4.36VHH56 pKa = 7.16LDD58 pKa = 3.14AQLRR62 pKa = 11.84RR63 pKa = 11.84RR64 pKa = 11.84QHH66 pKa = 4.96NAVRR70 pKa = 11.84EE71 pKa = 4.2SLLYY75 pKa = 9.68TLDD78 pKa = 3.44YY79 pKa = 11.17RR80 pKa = 11.84GDD82 pKa = 3.54TSIITATMNDD92 pKa = 4.24LLDD95 pKa = 4.31EE96 pKa = 4.38GHH98 pKa = 7.21VMLQDD103 pKa = 4.17AAPTPARR110 pKa = 11.84SPPTINPATLGPTFTTLTVYY130 pKa = 10.54EE131 pKa = 4.7PATHH135 pKa = 6.53HH136 pKa = 6.64AWSQPQLAPPLNHH149 pKa = 6.2TRR151 pKa = 11.84RR152 pKa = 11.84NLTPVKK158 pKa = 10.0FVPRR162 pKa = 11.84FTAAVIVEE170 pKa = 3.98LRR172 pKa = 11.84SRR174 pKa = 11.84LGQLPEE180 pKa = 4.67SIPGNALIVEE190 pKa = 4.61RR191 pKa = 11.84EE192 pKa = 4.09ALRR195 pKa = 11.84LMRR198 pKa = 11.84KK199 pKa = 8.84YY200 pKa = 10.67SVRR203 pKa = 11.84EE204 pKa = 3.69VDD206 pKa = 4.97AVTHH210 pKa = 6.29LPSIISCYY218 pKa = 9.45FRR220 pKa = 11.84EE221 pKa = 4.23DD222 pKa = 2.74LHH224 pKa = 7.9YY225 pKa = 10.49RR226 pKa = 11.84VEE228 pKa = 4.45TSVSRR233 pKa = 11.84MSKK236 pKa = 8.08FQRR239 pKa = 11.84WLVGEE244 pKa = 4.3AQPKK248 pKa = 10.11PSFTPLAA255 pKa = 4.35
MM1 pKa = 6.36VTTRR5 pKa = 11.84ANSEE9 pKa = 4.09FLPVTRR15 pKa = 11.84LSQPDD20 pKa = 3.93DD21 pKa = 3.45QPYY24 pKa = 6.93WTFWDD29 pKa = 3.36RR30 pKa = 11.84WKK32 pKa = 11.26SSFAEE37 pKa = 4.54FWSTSTITRR46 pKa = 11.84MCCCVDD52 pKa = 3.69PEE54 pKa = 4.36VHH56 pKa = 7.16LDD58 pKa = 3.14AQLRR62 pKa = 11.84RR63 pKa = 11.84RR64 pKa = 11.84QHH66 pKa = 4.96NAVRR70 pKa = 11.84EE71 pKa = 4.2SLLYY75 pKa = 9.68TLDD78 pKa = 3.44YY79 pKa = 11.17RR80 pKa = 11.84GDD82 pKa = 3.54TSIITATMNDD92 pKa = 4.24LLDD95 pKa = 4.31EE96 pKa = 4.38GHH98 pKa = 7.21VMLQDD103 pKa = 4.17AAPTPARR110 pKa = 11.84SPPTINPATLGPTFTTLTVYY130 pKa = 10.54EE131 pKa = 4.7PATHH135 pKa = 6.53HH136 pKa = 6.64AWSQPQLAPPLNHH149 pKa = 6.2TRR151 pKa = 11.84RR152 pKa = 11.84NLTPVKK158 pKa = 10.0FVPRR162 pKa = 11.84FTAAVIVEE170 pKa = 3.98LRR172 pKa = 11.84SRR174 pKa = 11.84LGQLPEE180 pKa = 4.67SIPGNALIVEE190 pKa = 4.61RR191 pKa = 11.84EE192 pKa = 4.09ALRR195 pKa = 11.84LMRR198 pKa = 11.84KK199 pKa = 8.84YY200 pKa = 10.67SVRR203 pKa = 11.84EE204 pKa = 3.69VDD206 pKa = 4.97AVTHH210 pKa = 6.29LPSIISCYY218 pKa = 9.45FRR220 pKa = 11.84EE221 pKa = 4.23DD222 pKa = 2.74LHH224 pKa = 7.9YY225 pKa = 10.49RR226 pKa = 11.84VEE228 pKa = 4.45TSVSRR233 pKa = 11.84MSKK236 pKa = 8.08FQRR239 pKa = 11.84WLVGEE244 pKa = 4.3AQPKK248 pKa = 10.11PSFTPLAA255 pKa = 4.35
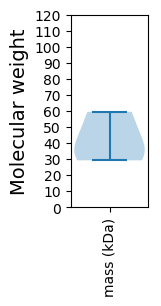
Molecular weight: 29.19 kDa
Isoelectric point according different methods:
Protein with the highest isoelectric point:
>tr|A0A1L3KG20|A0A1L3KG20_9VIRU Capsid protein OS=Changjiang tombus-like virus 8 OX=1922822 PE=3 SV=1
MM1 pKa = 7.55TNKK4 pKa = 9.29QQPKK8 pKa = 9.74KK9 pKa = 10.4GNLRR13 pKa = 11.84GAQQKK18 pKa = 10.74NSVPTMARR26 pKa = 11.84NDD28 pKa = 3.7SVRR31 pKa = 11.84AAPVALATRR40 pKa = 11.84RR41 pKa = 11.84NGTAARR47 pKa = 11.84MTTTNTGVTVTHH59 pKa = 7.22RR60 pKa = 11.84SFLMPVTNTLNYY72 pKa = 8.7TAFSVPCNPGMAGSFPWLCKK92 pKa = 9.31LARR95 pKa = 11.84RR96 pKa = 11.84YY97 pKa = 9.71EE98 pKa = 3.97EE99 pKa = 3.91YY100 pKa = 10.38RR101 pKa = 11.84FKK103 pKa = 11.01KK104 pKa = 9.95LRR106 pKa = 11.84YY107 pKa = 7.71EE108 pKa = 4.19FRR110 pKa = 11.84SVTASSQSGVVMMSFDD126 pKa = 3.91FDD128 pKa = 4.15AADD131 pKa = 3.72SAPSTKK137 pKa = 10.33AEE139 pKa = 4.05QAQTVPNTEE148 pKa = 3.96TNVWMNNDD156 pKa = 3.58LVVTPDD162 pKa = 3.93PKK164 pKa = 9.04WQYY167 pKa = 9.92VRR169 pKa = 11.84SGFLSSNLDD178 pKa = 2.87IKK180 pKa = 10.14TYY182 pKa = 11.54DD183 pKa = 3.84MGNLWLSTAYY193 pKa = 10.41GNNVVGGEE201 pKa = 4.33LYY203 pKa = 10.69VEE205 pKa = 4.24YY206 pKa = 9.78TVEE209 pKa = 4.14LRR211 pKa = 11.84KK212 pKa = 9.0PTDD215 pKa = 3.63GPEE218 pKa = 4.09TCGTWTADD226 pKa = 2.94TGAFSAPVNQTNVVSTGASFPFRR249 pKa = 11.84RR250 pKa = 11.84IDD252 pKa = 3.39NNNFEE257 pKa = 4.52VVSGGEE263 pKa = 3.96YY264 pKa = 10.46IMVCRR269 pKa = 11.84ASGTGLTAVIATPTIASSGTTALVSSIQTCVGGSSTINVLRR310 pKa = 11.84LRR312 pKa = 11.84VDD314 pKa = 3.23TGDD317 pKa = 3.37VIYY320 pKa = 9.9FANAGTGTTINATRR334 pKa = 11.84YY335 pKa = 7.16WVAPVDD341 pKa = 3.71YY342 pKa = 9.99TSIVV346 pKa = 3.09
MM1 pKa = 7.55TNKK4 pKa = 9.29QQPKK8 pKa = 9.74KK9 pKa = 10.4GNLRR13 pKa = 11.84GAQQKK18 pKa = 10.74NSVPTMARR26 pKa = 11.84NDD28 pKa = 3.7SVRR31 pKa = 11.84AAPVALATRR40 pKa = 11.84RR41 pKa = 11.84NGTAARR47 pKa = 11.84MTTTNTGVTVTHH59 pKa = 7.22RR60 pKa = 11.84SFLMPVTNTLNYY72 pKa = 8.7TAFSVPCNPGMAGSFPWLCKK92 pKa = 9.31LARR95 pKa = 11.84RR96 pKa = 11.84YY97 pKa = 9.71EE98 pKa = 3.97EE99 pKa = 3.91YY100 pKa = 10.38RR101 pKa = 11.84FKK103 pKa = 11.01KK104 pKa = 9.95LRR106 pKa = 11.84YY107 pKa = 7.71EE108 pKa = 4.19FRR110 pKa = 11.84SVTASSQSGVVMMSFDD126 pKa = 3.91FDD128 pKa = 4.15AADD131 pKa = 3.72SAPSTKK137 pKa = 10.33AEE139 pKa = 4.05QAQTVPNTEE148 pKa = 3.96TNVWMNNDD156 pKa = 3.58LVVTPDD162 pKa = 3.93PKK164 pKa = 9.04WQYY167 pKa = 9.92VRR169 pKa = 11.84SGFLSSNLDD178 pKa = 2.87IKK180 pKa = 10.14TYY182 pKa = 11.54DD183 pKa = 3.84MGNLWLSTAYY193 pKa = 10.41GNNVVGGEE201 pKa = 4.33LYY203 pKa = 10.69VEE205 pKa = 4.24YY206 pKa = 9.78TVEE209 pKa = 4.14LRR211 pKa = 11.84KK212 pKa = 9.0PTDD215 pKa = 3.63GPEE218 pKa = 4.09TCGTWTADD226 pKa = 2.94TGAFSAPVNQTNVVSTGASFPFRR249 pKa = 11.84RR250 pKa = 11.84IDD252 pKa = 3.39NNNFEE257 pKa = 4.52VVSGGEE263 pKa = 3.96YY264 pKa = 10.46IMVCRR269 pKa = 11.84ASGTGLTAVIATPTIASSGTTALVSSIQTCVGGSSTINVLRR310 pKa = 11.84LRR312 pKa = 11.84VDD314 pKa = 3.23TGDD317 pKa = 3.37VIYY320 pKa = 9.9FANAGTGTTINATRR334 pKa = 11.84YY335 pKa = 7.16WVAPVDD341 pKa = 3.71YY342 pKa = 9.99TSIVV346 pKa = 3.09
Molecular weight: 37.5 kDa
Isoelectric point according different methods:
Peptides (in silico digests for buttom-up proteomics)
Below you can find in silico digests of the whole proteome with Trypsin, Chymotrypsin, Trypsin+LysC, LysN, ArgC proteases suitable for different mass spec machines.| Try ESI |
 |
|---|
| ChTry ESI |
|
|---|
| ArgC ESI |
|
|---|
| LysN ESI |
|
|---|
| TryLysC ESI |
|
|---|
| Try MALDI |
|
|---|
| ChTry MALDI |
|
|---|
| ArgC MALDI |
|
|---|
| LysN MALDI |
|
|---|
| TryLysC MALDI |
|
|---|
| Try LTQ |
|
|---|
| ChTry LTQ |
|
|---|
| ArgC LTQ |
|
|---|
| LysN LTQ |
|
|---|
| TryLysC LTQ |
|
|---|
| Try MSlow |
|
|---|
| ChTry MSlow |
|
|---|
| ArgC MSlow |
|
|---|
| LysN MSlow |
|
|---|
| TryLysC MSlow |
|
|---|
| Try MShigh |
|
|---|
| ChTry MShigh |
|
|---|
| ArgC MShigh |
|
|---|
| LysN MShigh |
|
|---|
| TryLysC MShigh |
|
|---|
General Statistics
Number of major isoforms |
Number of additional isoforms |
Number of all proteins |
Number of amino acids |
Min. Seq. Length |
Max. Seq. Length |
Avg. Seq. Length |
Avg. Mol. Weight |
|---|---|---|---|---|---|---|---|
0 |
1124 |
255 |
523 |
374.7 |
42.05 |
Amino acid frequency
Ala |
Cys |
Asp |
Glu |
Phe |
Gly |
His |
Ile |
Lys |
Leu |
|---|---|---|---|---|---|---|---|---|---|
7.74 ± 0.477 | 2.135 ± 0.427 |
4.359 ± 0.119 | 4.715 ± 0.56 |
3.915 ± 0.066 | 5.872 ± 0.966 |
2.224 ± 0.71 | 3.381 ± 0.188 |
3.915 ± 0.856 | 7.74 ± 0.911 |
Met |
Asn |
Gln |
Pro |
Arg |
Ser |
Thr |
Val |
Trp |
Tyr |
|---|---|---|---|---|---|---|---|---|---|
2.936 ± 0.203 | 5.071 ± 0.811 |
5.516 ± 0.905 | 3.559 ± 0.242 |
7.117 ± 0.569 | 6.673 ± 0.779 |
8.185 ± 2.157 | 9.164 ± 0.585 |
1.423 ± 0.394 | 4.359 ± 0.706 |
Most of the basic statistics you can see at this page can be downloaded from this CSV file
See this proteome in:

Proteome-pI is available under Creative Commons Attribution-NoDerivs license, for more details see here
| Reference: Kozlowski LP. Proteome-pI 2.0: Proteome Isoelectric Point Database Update. Nucleic Acids Res. 2021, doi: 10.1093/nar/gkab944 | Contact: Lukasz P. Kozlowski |