Arthrobotrys flagrans
Taxonomy: cellular organisms; Eukaryota; Opisthokonta; Fungi; Dikarya; Ascomycota; saccharomyceta; Pezizomycotina; Orbiliomycetes; Orbiliales; Orbiliaceae; Arthrobotrys
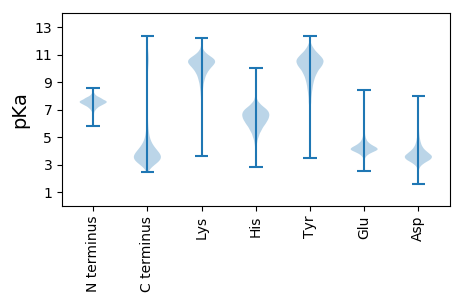
Average proteome isoelectric point is 6.56
Get precalculated fractions of proteins

Virtual 2D-PAGE plot for 10325 proteins (isoelectric point calculated using IPC2_protein)
Get csv file with sequences according to given criteria:
* You can choose from 21 different methods for calculating isoelectric point
Summary statistics related to proteome-wise predictions


Protein with the lowest isoelectric point:
>tr|A0A437A4J4|A0A437A4J4_9PEZI Uncharacterized protein OS=Arthrobotrys flagrans OX=97331 GN=DFL_004315 PE=4 SV=1
MM1 pKa = 7.75RR2 pKa = 11.84FSTLAFAAIAVLPSAISAFSLYY24 pKa = 10.49DD25 pKa = 3.29ISSDD29 pKa = 4.89LGDD32 pKa = 5.19ANDD35 pKa = 4.09KK36 pKa = 10.77CASQYY41 pKa = 10.89SIPLMSCGFLPGKK54 pKa = 10.49CSDD57 pKa = 3.46ACQEE61 pKa = 4.04QLQSLEE67 pKa = 4.05TTLQGVCKK75 pKa = 10.27DD76 pKa = 3.44SKK78 pKa = 11.06KK79 pKa = 10.29PQNLLLAALNDD90 pKa = 3.86GLVPALCVNAASSGSSSSSGSDD112 pKa = 3.32DD113 pKa = 3.82TPSATPTFMSGPGKK127 pKa = 8.92TPSSSAAQLTFSGVVEE143 pKa = 4.2ATSATEE149 pKa = 4.11DD150 pKa = 3.42QSEE153 pKa = 4.31PTGLVIDD160 pKa = 4.08TSVPEE165 pKa = 4.13TTATQTVAYY174 pKa = 8.89PEE176 pKa = 3.96NTYY179 pKa = 11.33APTTLQTSNSPASTTSSSSEE199 pKa = 3.65GSGNGGSNGSPFSSQDD215 pKa = 3.39DD216 pKa = 4.12NPNSGAAVRR225 pKa = 11.84VSAFGVAIGVFALIANIAA243 pKa = 3.37
MM1 pKa = 7.75RR2 pKa = 11.84FSTLAFAAIAVLPSAISAFSLYY24 pKa = 10.49DD25 pKa = 3.29ISSDD29 pKa = 4.89LGDD32 pKa = 5.19ANDD35 pKa = 4.09KK36 pKa = 10.77CASQYY41 pKa = 10.89SIPLMSCGFLPGKK54 pKa = 10.49CSDD57 pKa = 3.46ACQEE61 pKa = 4.04QLQSLEE67 pKa = 4.05TTLQGVCKK75 pKa = 10.27DD76 pKa = 3.44SKK78 pKa = 11.06KK79 pKa = 10.29PQNLLLAALNDD90 pKa = 3.86GLVPALCVNAASSGSSSSSGSDD112 pKa = 3.32DD113 pKa = 3.82TPSATPTFMSGPGKK127 pKa = 8.92TPSSSAAQLTFSGVVEE143 pKa = 4.2ATSATEE149 pKa = 4.11DD150 pKa = 3.42QSEE153 pKa = 4.31PTGLVIDD160 pKa = 4.08TSVPEE165 pKa = 4.13TTATQTVAYY174 pKa = 8.89PEE176 pKa = 3.96NTYY179 pKa = 11.33APTTLQTSNSPASTTSSSSEE199 pKa = 3.65GSGNGGSNGSPFSSQDD215 pKa = 3.39DD216 pKa = 4.12NPNSGAAVRR225 pKa = 11.84VSAFGVAIGVFALIANIAA243 pKa = 3.37
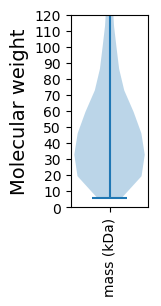
Molecular weight: 24.37 kDa
Isoelectric point according different methods:
Protein with the highest isoelectric point:
>tr|A0A436ZY54|A0A436ZY54_9PEZI Uncharacterized protein OS=Arthrobotrys flagrans OX=97331 GN=DFL_005670 PE=4 SV=1
MM1 pKa = 7.29TVLTLLRR8 pKa = 11.84RR9 pKa = 11.84PAVSCLRR16 pKa = 11.84SSSSLLSSTSRR27 pKa = 11.84RR28 pKa = 11.84TFTSLLRR35 pKa = 11.84TPTALATLQTRR46 pKa = 11.84PTPSTPTPLLPQTISPLLPSASTSLQGLVQTRR78 pKa = 11.84GHH80 pKa = 6.2RR81 pKa = 11.84RR82 pKa = 11.84KK83 pKa = 8.38TYY85 pKa = 8.98NPSHH89 pKa = 7.03IVRR92 pKa = 11.84KK93 pKa = 9.74RR94 pKa = 11.84RR95 pKa = 11.84FGFLARR101 pKa = 11.84LRR103 pKa = 11.84SKK105 pKa = 9.3TGKK108 pKa = 10.27NILKK112 pKa = 9.96RR113 pKa = 11.84RR114 pKa = 11.84KK115 pKa = 9.1AKK117 pKa = 8.97GRR119 pKa = 11.84KK120 pKa = 8.03MLTHH124 pKa = 7.27
MM1 pKa = 7.29TVLTLLRR8 pKa = 11.84RR9 pKa = 11.84PAVSCLRR16 pKa = 11.84SSSSLLSSTSRR27 pKa = 11.84RR28 pKa = 11.84TFTSLLRR35 pKa = 11.84TPTALATLQTRR46 pKa = 11.84PTPSTPTPLLPQTISPLLPSASTSLQGLVQTRR78 pKa = 11.84GHH80 pKa = 6.2RR81 pKa = 11.84RR82 pKa = 11.84KK83 pKa = 8.38TYY85 pKa = 8.98NPSHH89 pKa = 7.03IVRR92 pKa = 11.84KK93 pKa = 9.74RR94 pKa = 11.84RR95 pKa = 11.84FGFLARR101 pKa = 11.84LRR103 pKa = 11.84SKK105 pKa = 9.3TGKK108 pKa = 10.27NILKK112 pKa = 9.96RR113 pKa = 11.84RR114 pKa = 11.84KK115 pKa = 9.1AKK117 pKa = 8.97GRR119 pKa = 11.84KK120 pKa = 8.03MLTHH124 pKa = 7.27
Molecular weight: 13.87 kDa
Isoelectric point according different methods:
Peptides (in silico digests for buttom-up proteomics)
Below you can find in silico digests of the whole proteome with Trypsin, Chymotrypsin, Trypsin+LysC, LysN, ArgC proteases suitable for different mass spec machines.| Try ESI |
 |
|---|
| ChTry ESI |
 |
|---|
| ArgC ESI |
 |
|---|
| LysN ESI |
 |
|---|
| TryLysC ESI |
 |
|---|
| Try MALDI |
 |
|---|
| ChTry MALDI |
 |
|---|
| ArgC MALDI |
 |
|---|
| LysN MALDI |
 |
|---|
| TryLysC MALDI |
 |
|---|
| Try LTQ |
 |
|---|
| ChTry LTQ |
 |
|---|
| ArgC LTQ |
 |
|---|
| LysN LTQ |
 |
|---|
| TryLysC LTQ |
 |
|---|
| Try MSlow |
 |
|---|
| ChTry MSlow |
 |
|---|
| ArgC MSlow |
 |
|---|
| LysN MSlow |
 |
|---|
| TryLysC MSlow |
 |
|---|
| Try MShigh |
 |
|---|
| ChTry MShigh |
 |
|---|
| ArgC MShigh |
 |
|---|
| LysN MShigh |
 |
|---|
| TryLysC MShigh |
 |
|---|
General Statistics
Number of major isoforms |
Number of additional isoforms |
Number of all proteins |
Number of amino acids |
Min. Seq. Length |
Max. Seq. Length |
Avg. Seq. Length |
Avg. Mol. Weight |
|---|---|---|---|---|---|---|---|
5006540 |
66 |
12066 |
484.9 |
53.76 |
Amino acid frequency
Ala |
Cys |
Asp |
Glu |
Phe |
Gly |
His |
Ile |
Lys |
Leu |
|---|---|---|---|---|---|---|---|---|---|
7.793 ± 0.022 | 1.157 ± 0.01 |
5.594 ± 0.016 | 6.648 ± 0.03 |
3.679 ± 0.015 | 6.864 ± 0.023 |
2.2 ± 0.011 | 5.275 ± 0.016 |
5.602 ± 0.025 | 8.489 ± 0.024 |
Met |
Asn |
Gln |
Pro |
Arg |
Ser |
Thr |
Val |
Trp |
Tyr |
|---|---|---|---|---|---|---|---|---|---|
2.039 ± 0.009 | 3.979 ± 0.012 |
6.282 ± 0.035 | 3.789 ± 0.02 |
5.866 ± 0.022 | 8.247 ± 0.027 |
6.329 ± 0.02 | 5.979 ± 0.019 |
1.321 ± 0.009 | 2.868 ± 0.014 |
Most of the basic statistics you can see at this page can be downloaded from this CSV file
Proteome-pI is available under Creative Commons Attribution-NoDerivs license, for more details see here
| Reference: Kozlowski LP. Proteome-pI 2.0: Proteome Isoelectric Point Database Update. Nucleic Acids Res. 2021, doi: 10.1093/nar/gkab944 | Contact: Lukasz P. Kozlowski |
