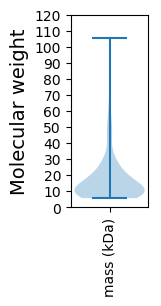
Myoviridae sp. ctThM1
Taxonomy: Viruses; Duplodnaviria; Heunggongvirae; Uroviricota; Caudoviricetes; Caudovirales; Myoviridae; unclassified Myoviridae
Average proteome isoelectric point is 6.04
Get precalculated fractions of proteins

Virtual 2D-PAGE plot for 156 proteins (isoelectric point calculated using IPC2_protein)
Get csv file with sequences according to given criteria:
* You can choose from 21 different methods for calculating isoelectric point
Summary statistics related to proteome-wise predictions


Protein with the lowest isoelectric point:
>tr|A0A5Q2W8L4|A0A5Q2W8L4_9CAUD Uncharacterized protein OS=Myoviridae sp. ctThM1 OX=2656730 PE=4 SV=1
MM1 pKa = 7.26MSNIKK6 pKa = 9.84QLLKK10 pKa = 10.6QYY12 pKa = 10.7EE13 pKa = 4.34EE14 pKa = 4.51VNAEE18 pKa = 4.04LNKK21 pKa = 10.18QIKK24 pKa = 10.37DD25 pKa = 3.27NGEE28 pKa = 3.74AFIQEE33 pKa = 4.62LFQDD37 pKa = 3.83VFDD40 pKa = 3.88NHH42 pKa = 6.47QGLNVIGVVGWTMGFNDD59 pKa = 5.3GEE61 pKa = 4.37ACYY64 pKa = 9.06HH65 pKa = 4.79QQYY68 pKa = 10.29IYY70 pKa = 10.63TGVPAWKK77 pKa = 9.71DD78 pKa = 3.38YY79 pKa = 10.96PDD81 pKa = 4.2FYY83 pKa = 11.29EE84 pKa = 4.04EE85 pKa = 4.15SGNFEE90 pKa = 4.04EE91 pKa = 6.08DD92 pKa = 3.55FEE94 pKa = 5.23FDD96 pKa = 3.48EE97 pKa = 5.51EE98 pKa = 4.49EE99 pKa = 4.16NKK101 pKa = 10.47HH102 pKa = 6.35LNSEE106 pKa = 4.34CSTLQQAKK114 pKa = 9.86AQVEE118 pKa = 4.41AYY120 pKa = 10.42DD121 pKa = 4.2EE122 pKa = 4.5IIEE125 pKa = 4.44RR126 pKa = 11.84VFGTNFRR133 pKa = 11.84IVATRR138 pKa = 11.84NEE140 pKa = 4.54DD141 pKa = 2.99NTAAVSVDD149 pKa = 3.88EE150 pKa = 4.49YY151 pKa = 11.37DD152 pKa = 3.56CGYY155 pKa = 11.34
MM1 pKa = 7.26MSNIKK6 pKa = 9.84QLLKK10 pKa = 10.6QYY12 pKa = 10.7EE13 pKa = 4.34EE14 pKa = 4.51VNAEE18 pKa = 4.04LNKK21 pKa = 10.18QIKK24 pKa = 10.37DD25 pKa = 3.27NGEE28 pKa = 3.74AFIQEE33 pKa = 4.62LFQDD37 pKa = 3.83VFDD40 pKa = 3.88NHH42 pKa = 6.47QGLNVIGVVGWTMGFNDD59 pKa = 5.3GEE61 pKa = 4.37ACYY64 pKa = 9.06HH65 pKa = 4.79QQYY68 pKa = 10.29IYY70 pKa = 10.63TGVPAWKK77 pKa = 9.71DD78 pKa = 3.38YY79 pKa = 10.96PDD81 pKa = 4.2FYY83 pKa = 11.29EE84 pKa = 4.04EE85 pKa = 4.15SGNFEE90 pKa = 4.04EE91 pKa = 6.08DD92 pKa = 3.55FEE94 pKa = 5.23FDD96 pKa = 3.48EE97 pKa = 5.51EE98 pKa = 4.49EE99 pKa = 4.16NKK101 pKa = 10.47HH102 pKa = 6.35LNSEE106 pKa = 4.34CSTLQQAKK114 pKa = 9.86AQVEE118 pKa = 4.41AYY120 pKa = 10.42DD121 pKa = 4.2EE122 pKa = 4.5IIEE125 pKa = 4.44RR126 pKa = 11.84VFGTNFRR133 pKa = 11.84IVATRR138 pKa = 11.84NEE140 pKa = 4.54DD141 pKa = 2.99NTAAVSVDD149 pKa = 3.88EE150 pKa = 4.49YY151 pKa = 11.37DD152 pKa = 3.56CGYY155 pKa = 11.34
Molecular weight: 17.97 kDa
Isoelectric point according different methods:
Protein with the highest isoelectric point:
>tr|A0A5Q2W386|A0A5Q2W386_9CAUD Uncharacterized protein OS=Myoviridae sp. ctThM1 OX=2656730 PE=4 SV=1
MM1 pKa = 7.7ANILPILVVLPYY13 pKa = 10.08VVSTIRR19 pKa = 11.84YY20 pKa = 7.29RR21 pKa = 11.84SRR23 pKa = 11.84SKK25 pKa = 10.55IQVFQCFFKK34 pKa = 11.26LFDD37 pKa = 3.88TNKK40 pKa = 9.95LRR42 pKa = 11.84VFQLPITRR50 pKa = 11.84FASKK54 pKa = 9.33TLLFLSRR61 pKa = 11.84NNCAIFVTIFATMAQTAMFCVYY83 pKa = 10.0IFHH86 pKa = 7.48LLPLKK91 pKa = 10.32IYY93 pKa = 10.12PKK95 pKa = 10.75
MM1 pKa = 7.7ANILPILVVLPYY13 pKa = 10.08VVSTIRR19 pKa = 11.84YY20 pKa = 7.29RR21 pKa = 11.84SRR23 pKa = 11.84SKK25 pKa = 10.55IQVFQCFFKK34 pKa = 11.26LFDD37 pKa = 3.88TNKK40 pKa = 9.95LRR42 pKa = 11.84VFQLPITRR50 pKa = 11.84FASKK54 pKa = 9.33TLLFLSRR61 pKa = 11.84NNCAIFVTIFATMAQTAMFCVYY83 pKa = 10.0IFHH86 pKa = 7.48LLPLKK91 pKa = 10.32IYY93 pKa = 10.12PKK95 pKa = 10.75
Molecular weight: 11.14 kDa
Isoelectric point according different methods:
Peptides (in silico digests for buttom-up proteomics)
Below you can find in silico digests of the whole proteome with Trypsin, Chymotrypsin, Trypsin+LysC, LysN, ArgC proteases suitable for different mass spec machines.| Try ESI |
 |
|---|
| ChTry ESI |
 |
|---|
| ArgC ESI |
 |
|---|
| LysN ESI |
 |
|---|
| TryLysC ESI |
 |
|---|
| Try MALDI |
 |
|---|
| ChTry MALDI |
 |
|---|
| ArgC MALDI |
 |
|---|
| LysN MALDI |
 |
|---|
| TryLysC MALDI |
 |
|---|
| Try LTQ |
 |
|---|
| ChTry LTQ |
 |
|---|
| ArgC LTQ |
 |
|---|
| LysN LTQ |
 |
|---|
| TryLysC LTQ |
 |
|---|
| Try MSlow |
 |
|---|
| ChTry MSlow |
 |
|---|
| ArgC MSlow |
 |
|---|
| LysN MSlow |
 |
|---|
| TryLysC MSlow |
 |
|---|
| Try MShigh |
 |
|---|
| ChTry MShigh |
 |
|---|
| ArgC MShigh |
 |
|---|
| LysN MShigh |
 |
|---|
| TryLysC MShigh |
 |
|---|
General Statistics
Number of major isoforms |
Number of additional isoforms |
Number of all proteins |
Number of amino acids |
Min. Seq. Length |
Max. Seq. Length |
Avg. Seq. Length |
Avg. Mol. Weight |
|---|---|---|---|---|---|---|---|
0 |
24069 |
50 |
934 |
154.3 |
17.56 |
Amino acid frequency
Ala |
Cys |
Asp |
Glu |
Phe |
Gly |
His |
Ile |
Lys |
Leu |
|---|---|---|---|---|---|---|---|---|---|
6.498 ± 0.255 | 1.695 ± 0.15 |
6.012 ± 0.22 | 7.728 ± 0.266 |
4.429 ± 0.143 | 6.332 ± 0.223 |
1.762 ± 0.132 | 6.099 ± 0.172 |
7.449 ± 0.266 | 8.027 ± 0.174 |
Met |
Asn |
Gln |
Pro |
Arg |
Ser |
Thr |
Val |
Trp |
Tyr |
|---|---|---|---|---|---|---|---|---|---|
2.46 ± 0.111 | 5.019 ± 0.145 |
3.207 ± 0.117 | 3.822 ± 0.169 |
4.404 ± 0.193 | 6.502 ± 0.186 |
5.65 ± 0.221 | 6.726 ± 0.179 |
1.6 ± 0.106 | 4.579 ± 0.16 |
Most of the basic statistics you can see at this page can be downloaded from this CSV file
Proteome-pI is available under Creative Commons Attribution-NoDerivs license, for more details see here
| Reference: Kozlowski LP. Proteome-pI 2.0: Proteome Isoelectric Point Database Update. Nucleic Acids Res. 2021, doi: 10.1093/nar/gkab944 | Contact: Lukasz P. Kozlowski |
