Aminomonas paucivorans DSM 12260
Taxonomy: cellular organisms; Bacteria; Synergistetes; Synergistia; Synergistales; Synergistaceae; Aminomonas; Aminomonas paucivorans
Average proteome isoelectric point is 6.59
Get precalculated fractions of proteins

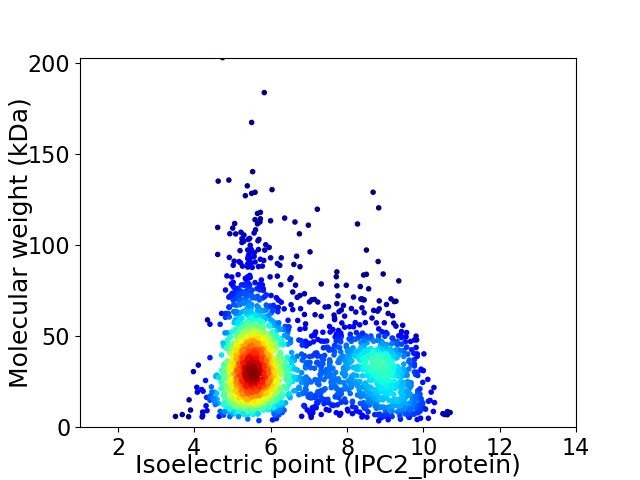
Virtual 2D-PAGE plot for 2391 proteins (isoelectric point calculated using IPC2_protein)
Get csv file with sequences according to given criteria:
* You can choose from 21 different methods for calculating isoelectric point
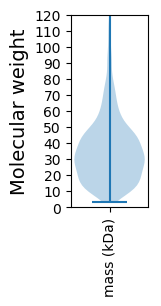
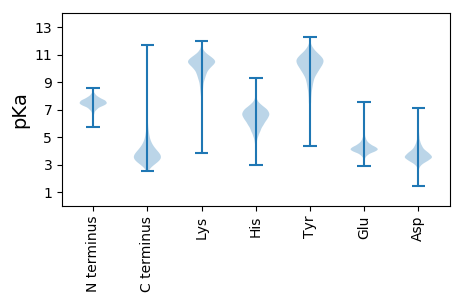
Summary statistics related to proteome-wise predictions


Protein with the lowest isoelectric point:
>tr|E3CYW7|E3CYW7_9BACT Transcriptional regulator AraC family OS=Aminomonas paucivorans DSM 12260 OX=584708 GN=Apau_2151 PE=4 SV=1
MM1 pKa = 7.72AARR4 pKa = 11.84EE5 pKa = 4.02KK6 pKa = 10.37IAYY9 pKa = 9.46LKK11 pKa = 11.04GLIDD15 pKa = 3.91GQKK18 pKa = 10.25PADD21 pKa = 4.19PDD23 pKa = 3.81TAKK26 pKa = 11.15LLGAVVDD33 pKa = 4.62ALDD36 pKa = 4.15GLADD40 pKa = 4.01DD41 pKa = 5.84LEE43 pKa = 4.65NQGIRR48 pKa = 11.84LEE50 pKa = 4.11EE51 pKa = 3.86HH52 pKa = 6.9RR53 pKa = 11.84EE54 pKa = 3.77ILDD57 pKa = 3.65EE58 pKa = 4.1VSEE61 pKa = 4.18YY62 pKa = 11.04LDD64 pKa = 4.79QIDD67 pKa = 4.58EE68 pKa = 4.41DD69 pKa = 4.26LCALEE74 pKa = 5.93DD75 pKa = 4.59RR76 pKa = 11.84IEE78 pKa = 4.2SCEE81 pKa = 4.0DD82 pKa = 3.22EE83 pKa = 4.89EE84 pKa = 4.37EE85 pKa = 5.56GEE87 pKa = 4.92DD88 pKa = 4.27EE89 pKa = 4.33EE90 pKa = 4.58EE91 pKa = 5.15DD92 pKa = 4.25YY93 pKa = 11.32ISVCCPHH100 pKa = 6.45CRR102 pKa = 11.84KK103 pKa = 10.49DD104 pKa = 3.6FFYY107 pKa = 11.1DD108 pKa = 3.37PTAYY112 pKa = 10.08EE113 pKa = 3.91EE114 pKa = 5.91DD115 pKa = 3.94EE116 pKa = 5.6DD117 pKa = 5.29LLCPHH122 pKa = 7.02CGEE125 pKa = 4.75PFKK128 pKa = 11.05QPEE131 pKa = 3.85II132 pKa = 4.05
MM1 pKa = 7.72AARR4 pKa = 11.84EE5 pKa = 4.02KK6 pKa = 10.37IAYY9 pKa = 9.46LKK11 pKa = 11.04GLIDD15 pKa = 3.91GQKK18 pKa = 10.25PADD21 pKa = 4.19PDD23 pKa = 3.81TAKK26 pKa = 11.15LLGAVVDD33 pKa = 4.62ALDD36 pKa = 4.15GLADD40 pKa = 4.01DD41 pKa = 5.84LEE43 pKa = 4.65NQGIRR48 pKa = 11.84LEE50 pKa = 4.11EE51 pKa = 3.86HH52 pKa = 6.9RR53 pKa = 11.84EE54 pKa = 3.77ILDD57 pKa = 3.65EE58 pKa = 4.1VSEE61 pKa = 4.18YY62 pKa = 11.04LDD64 pKa = 4.79QIDD67 pKa = 4.58EE68 pKa = 4.41DD69 pKa = 4.26LCALEE74 pKa = 5.93DD75 pKa = 4.59RR76 pKa = 11.84IEE78 pKa = 4.2SCEE81 pKa = 4.0DD82 pKa = 3.22EE83 pKa = 4.89EE84 pKa = 4.37EE85 pKa = 5.56GEE87 pKa = 4.92DD88 pKa = 4.27EE89 pKa = 4.33EE90 pKa = 4.58EE91 pKa = 5.15DD92 pKa = 4.25YY93 pKa = 11.32ISVCCPHH100 pKa = 6.45CRR102 pKa = 11.84KK103 pKa = 10.49DD104 pKa = 3.6FFYY107 pKa = 11.1DD108 pKa = 3.37PTAYY112 pKa = 10.08EE113 pKa = 3.91EE114 pKa = 5.91DD115 pKa = 3.94EE116 pKa = 5.6DD117 pKa = 5.29LLCPHH122 pKa = 7.02CGEE125 pKa = 4.75PFKK128 pKa = 11.05QPEE131 pKa = 3.85II132 pKa = 4.05
Molecular weight: 15.01 kDa
Isoelectric point according different methods:
Protein with the highest isoelectric point:
>tr|E3D143|E3D143_9BACT Asparaginase/glutaminase OS=Aminomonas paucivorans DSM 12260 OX=584708 GN=Apau_1530 PE=4 SV=1
MM1 pKa = 7.82IKK3 pKa = 10.17PQGARR8 pKa = 11.84AALLLPLLPLTLFLLSFTLGRR29 pKa = 11.84YY30 pKa = 7.68PIPLPTVLKK39 pKa = 10.42ILAAKK44 pKa = 8.06FFPLTPHH51 pKa = 6.62WPDD54 pKa = 2.92TMEE57 pKa = 4.06TVLWNLRR64 pKa = 11.84LPRR67 pKa = 11.84ALGAMMVGAALSSSGCAFQGLFRR90 pKa = 11.84NPLVSPYY97 pKa = 10.68VLGVAAGSGFGACLAILFTEE117 pKa = 4.48TRR119 pKa = 11.84WIVQLSATLFGMVAVLGATGLSGIYY144 pKa = 9.75RR145 pKa = 11.84KK146 pKa = 10.24ASTLVLVLGGIIVGSFFSALISLLKK171 pKa = 10.37FQADD175 pKa = 4.07PYY177 pKa = 9.63EE178 pKa = 4.51KK179 pKa = 10.38LPAMVFWLMGSLARR193 pKa = 11.84VSLTNLLAVAPMMAVGLGVLLALRR217 pKa = 11.84WRR219 pKa = 11.84LNLLAFGEE227 pKa = 4.43QEE229 pKa = 4.06AQALGAEE236 pKa = 4.76VVRR239 pKa = 11.84EE240 pKa = 3.71RR241 pKa = 11.84WLVILACTLLTSSAVCLAGVIGWVGLVIPHH271 pKa = 7.27IGRR274 pKa = 11.84LLVGPDD280 pKa = 2.97IRR282 pKa = 11.84RR283 pKa = 11.84LLPASISLGSFYY295 pKa = 11.21LLLVDD300 pKa = 3.94TLSRR304 pKa = 11.84TLSASEE310 pKa = 4.04IPLGILTALIGAPFFAWLLSRR331 pKa = 11.84NRR333 pKa = 11.84VAWRR337 pKa = 3.38
MM1 pKa = 7.82IKK3 pKa = 10.17PQGARR8 pKa = 11.84AALLLPLLPLTLFLLSFTLGRR29 pKa = 11.84YY30 pKa = 7.68PIPLPTVLKK39 pKa = 10.42ILAAKK44 pKa = 8.06FFPLTPHH51 pKa = 6.62WPDD54 pKa = 2.92TMEE57 pKa = 4.06TVLWNLRR64 pKa = 11.84LPRR67 pKa = 11.84ALGAMMVGAALSSSGCAFQGLFRR90 pKa = 11.84NPLVSPYY97 pKa = 10.68VLGVAAGSGFGACLAILFTEE117 pKa = 4.48TRR119 pKa = 11.84WIVQLSATLFGMVAVLGATGLSGIYY144 pKa = 9.75RR145 pKa = 11.84KK146 pKa = 10.24ASTLVLVLGGIIVGSFFSALISLLKK171 pKa = 10.37FQADD175 pKa = 4.07PYY177 pKa = 9.63EE178 pKa = 4.51KK179 pKa = 10.38LPAMVFWLMGSLARR193 pKa = 11.84VSLTNLLAVAPMMAVGLGVLLALRR217 pKa = 11.84WRR219 pKa = 11.84LNLLAFGEE227 pKa = 4.43QEE229 pKa = 4.06AQALGAEE236 pKa = 4.76VVRR239 pKa = 11.84EE240 pKa = 3.71RR241 pKa = 11.84WLVILACTLLTSSAVCLAGVIGWVGLVIPHH271 pKa = 7.27IGRR274 pKa = 11.84LLVGPDD280 pKa = 2.97IRR282 pKa = 11.84RR283 pKa = 11.84LLPASISLGSFYY295 pKa = 11.21LLLVDD300 pKa = 3.94TLSRR304 pKa = 11.84TLSASEE310 pKa = 4.04IPLGILTALIGAPFFAWLLSRR331 pKa = 11.84NRR333 pKa = 11.84VAWRR337 pKa = 3.38
Molecular weight: 36.12 kDa
Isoelectric point according different methods:
Peptides (in silico digests for buttom-up proteomics)
Below you can find in silico digests of the whole proteome with Trypsin, Chymotrypsin, Trypsin+LysC, LysN, ArgC proteases suitable for different mass spec machines.| Try ESI |
 |
|---|
| ChTry ESI |
 |
|---|
| ArgC ESI |
 |
|---|
| LysN ESI |
 |
|---|
| TryLysC ESI |
 |
|---|
| Try MALDI |
 |
|---|
| ChTry MALDI |
 |
|---|
| ArgC MALDI |
 |
|---|
| LysN MALDI |
 |
|---|
| TryLysC MALDI |
 |
|---|
| Try LTQ |
 |
|---|
| ChTry LTQ |
 |
|---|
| ArgC LTQ |
 |
|---|
| LysN LTQ |
 |
|---|
| TryLysC LTQ |
 |
|---|
| Try MSlow |
 |
|---|
| ChTry MSlow |
 |
|---|
| ArgC MSlow |
 |
|---|
| LysN MSlow |
 |
|---|
| TryLysC MSlow |
 |
|---|
| Try MShigh |
 |
|---|
| ChTry MShigh |
 |
|---|
| ArgC MShigh |
 |
|---|
| LysN MShigh |
 |
|---|
| TryLysC MShigh |
 |
|---|
General Statistics
Number of major isoforms |
Number of additional isoforms |
Number of all proteins |
Number of amino acids |
Min. Seq. Length |
Max. Seq. Length |
Avg. Seq. Length |
Avg. Mol. Weight |
|---|---|---|---|---|---|---|---|
0 |
794651 |
31 |
1932 |
332.4 |
36.35 |
Amino acid frequency
Ala |
Cys |
Asp |
Glu |
Phe |
Gly |
His |
Ile |
Lys |
Leu |
|---|---|---|---|---|---|---|---|---|---|
10.178 ± 0.052 | 1.281 ± 0.019 |
5.015 ± 0.036 | 7.231 ± 0.055 |
3.627 ± 0.031 | 9.623 ± 0.048 |
1.841 ± 0.021 | 3.427 ± 0.038 |
3.028 ± 0.043 | 12.444 ± 0.072 |
Met |
Asn |
Gln |
Pro |
Arg |
Ser |
Thr |
Val |
Trp |
Tyr |
|---|---|---|---|---|---|---|---|---|---|
1.975 ± 0.02 | 1.996 ± 0.029 |
5.675 ± 0.042 | 2.883 ± 0.029 |
8.492 ± 0.061 | 5.13 ± 0.03 |
4.623 ± 0.031 | 8.049 ± 0.044 |
1.392 ± 0.019 | 2.089 ± 0.024 |
Most of the basic statistics you can see at this page can be downloaded from this CSV file
Proteome-pI is available under Creative Commons Attribution-NoDerivs license, for more details see here
| Reference: Kozlowski LP. Proteome-pI 2.0: Proteome Isoelectric Point Database Update. Nucleic Acids Res. 2021, doi: 10.1093/nar/gkab944 | Contact: Lukasz P. Kozlowski |
