halophilic archaeon DL31
Taxonomy: cellular organisms; Archaea; Euryarchaeota; Stenosarchaea group; Halobacteria; Haloferacales; unclassified Haloferacales
Average proteome isoelectric point is 4.95
Get precalculated fractions of proteins

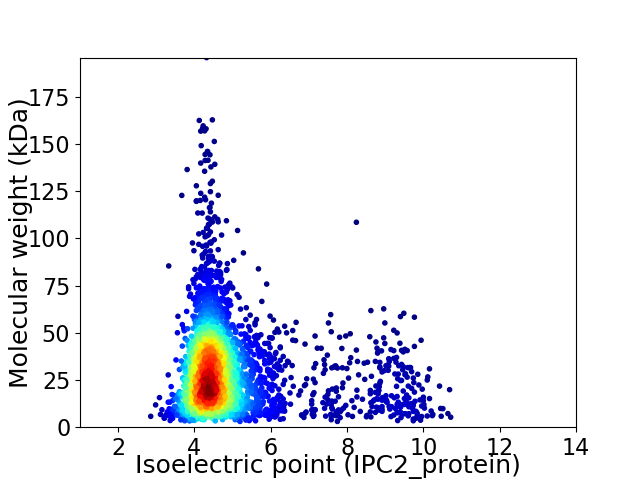
Virtual 2D-PAGE plot for 3413 proteins (isoelectric point calculated using IPC2_protein)
Get csv file with sequences according to given criteria:
* You can choose from 21 different methods for calculating isoelectric point
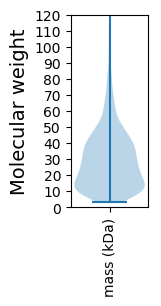
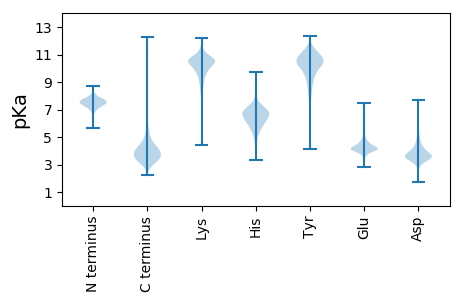
Summary statistics related to proteome-wise predictions


Protein with the lowest isoelectric point:
>tr|G2MKS8|G2MKS8_9EURY Uncharacterized protein OS=halophilic archaeon DL31 OX=756883 GN=Halar_1443 PE=4 SV=1
MM1 pKa = 7.41TFQLSWHH8 pKa = 5.88GHH10 pKa = 4.39STWTVTVDD18 pKa = 3.26DD19 pKa = 4.73TEE21 pKa = 4.26FLIDD25 pKa = 4.26PFFDD29 pKa = 4.4NPFTDD34 pKa = 4.82LDD36 pKa = 4.16PEE38 pKa = 4.26EE39 pKa = 5.44LDD41 pKa = 3.94PDD43 pKa = 3.98HH44 pKa = 8.01VLITHH49 pKa = 6.45GHH51 pKa = 5.75TDD53 pKa = 4.17HH54 pKa = 7.16IADD57 pKa = 3.43SDD59 pKa = 4.0RR60 pKa = 11.84FEE62 pKa = 4.29GTHH65 pKa = 6.26FVGTPEE71 pKa = 3.55ITGYY75 pKa = 8.77LTDD78 pKa = 5.01NYY80 pKa = 10.73DD81 pKa = 3.14IDD83 pKa = 5.04DD84 pKa = 4.1ATGMNLGGTVEE95 pKa = 4.6LGDD98 pKa = 3.94AFVTMVRR105 pKa = 11.84ADD107 pKa = 3.54HH108 pKa = 6.9SNGIDD113 pKa = 3.12TGYY116 pKa = 8.57GTSGGMPAGYY126 pKa = 9.86VISDD130 pKa = 3.75TKK132 pKa = 9.75PTQEE136 pKa = 4.24SDD138 pKa = 3.03ADD140 pKa = 3.73STTFYY145 pKa = 10.75HH146 pKa = 7.34AGDD149 pKa = 3.68TSLMSEE155 pKa = 4.11MKK157 pKa = 10.48DD158 pKa = 3.43YY159 pKa = 10.83IGPFLEE165 pKa = 4.81PDD167 pKa = 3.41AVAMPVGDD175 pKa = 4.8HH176 pKa = 5.4YY177 pKa = 10.22TMGPAQAAIAVDD189 pKa = 3.62WVDD192 pKa = 3.61PDD194 pKa = 3.63VAFPMHH200 pKa = 7.13YY201 pKa = 8.75DD202 pKa = 3.74TFPAIEE208 pKa = 3.9VDD210 pKa = 2.65IDD212 pKa = 3.42QFGRR216 pKa = 11.84EE217 pKa = 4.09VKK219 pKa = 9.79ATGNDD224 pKa = 3.13ADD226 pKa = 4.24VVVLDD231 pKa = 4.09GDD233 pKa = 3.65EE234 pKa = 4.76SYY236 pKa = 10.64TLAEE240 pKa = 4.14
MM1 pKa = 7.41TFQLSWHH8 pKa = 5.88GHH10 pKa = 4.39STWTVTVDD18 pKa = 3.26DD19 pKa = 4.73TEE21 pKa = 4.26FLIDD25 pKa = 4.26PFFDD29 pKa = 4.4NPFTDD34 pKa = 4.82LDD36 pKa = 4.16PEE38 pKa = 4.26EE39 pKa = 5.44LDD41 pKa = 3.94PDD43 pKa = 3.98HH44 pKa = 8.01VLITHH49 pKa = 6.45GHH51 pKa = 5.75TDD53 pKa = 4.17HH54 pKa = 7.16IADD57 pKa = 3.43SDD59 pKa = 4.0RR60 pKa = 11.84FEE62 pKa = 4.29GTHH65 pKa = 6.26FVGTPEE71 pKa = 3.55ITGYY75 pKa = 8.77LTDD78 pKa = 5.01NYY80 pKa = 10.73DD81 pKa = 3.14IDD83 pKa = 5.04DD84 pKa = 4.1ATGMNLGGTVEE95 pKa = 4.6LGDD98 pKa = 3.94AFVTMVRR105 pKa = 11.84ADD107 pKa = 3.54HH108 pKa = 6.9SNGIDD113 pKa = 3.12TGYY116 pKa = 8.57GTSGGMPAGYY126 pKa = 9.86VISDD130 pKa = 3.75TKK132 pKa = 9.75PTQEE136 pKa = 4.24SDD138 pKa = 3.03ADD140 pKa = 3.73STTFYY145 pKa = 10.75HH146 pKa = 7.34AGDD149 pKa = 3.68TSLMSEE155 pKa = 4.11MKK157 pKa = 10.48DD158 pKa = 3.43YY159 pKa = 10.83IGPFLEE165 pKa = 4.81PDD167 pKa = 3.41AVAMPVGDD175 pKa = 4.8HH176 pKa = 5.4YY177 pKa = 10.22TMGPAQAAIAVDD189 pKa = 3.62WVDD192 pKa = 3.61PDD194 pKa = 3.63VAFPMHH200 pKa = 7.13YY201 pKa = 8.75DD202 pKa = 3.74TFPAIEE208 pKa = 3.9VDD210 pKa = 2.65IDD212 pKa = 3.42QFGRR216 pKa = 11.84EE217 pKa = 4.09VKK219 pKa = 9.79ATGNDD224 pKa = 3.13ADD226 pKa = 4.24VVVLDD231 pKa = 4.09GDD233 pKa = 3.65EE234 pKa = 4.76SYY236 pKa = 10.64TLAEE240 pKa = 4.14
Molecular weight: 26.16 kDa
Isoelectric point according different methods:
Protein with the highest isoelectric point:
>tr|G2MJP7|G2MJP7_9EURY PMT_2 domain-containing protein OS=halophilic archaeon DL31 OX=756883 GN=Halar_1355 PE=4 SV=1
MM1 pKa = 7.44GLHH4 pKa = 6.26RR5 pKa = 11.84MKK7 pKa = 10.7LGMVLAVGLGSLTFAQSLLTVGNPTARR34 pKa = 11.84QAVRR38 pKa = 11.84ALIGNATPRR47 pKa = 11.84VVTLL51 pKa = 3.92
MM1 pKa = 7.44GLHH4 pKa = 6.26RR5 pKa = 11.84MKK7 pKa = 10.7LGMVLAVGLGSLTFAQSLLTVGNPTARR34 pKa = 11.84QAVRR38 pKa = 11.84ALIGNATPRR47 pKa = 11.84VVTLL51 pKa = 3.92
Molecular weight: 5.3 kDa
Isoelectric point according different methods:
Peptides (in silico digests for buttom-up proteomics)
Below you can find in silico digests of the whole proteome with Trypsin, Chymotrypsin, Trypsin+LysC, LysN, ArgC proteases suitable for different mass spec machines.| Try ESI |
 |
|---|
| ChTry ESI |
 |
|---|
| ArgC ESI |
 |
|---|
| LysN ESI |
 |
|---|
| TryLysC ESI |
 |
|---|
| Try MALDI |
 |
|---|
| ChTry MALDI |
 |
|---|
| ArgC MALDI |
 |
|---|
| LysN MALDI |
 |
|---|
| TryLysC MALDI |
 |
|---|
| Try LTQ |
 |
|---|
| ChTry LTQ |
 |
|---|
| ArgC LTQ |
 |
|---|
| LysN LTQ |
 |
|---|
| TryLysC LTQ |
 |
|---|
| Try MSlow |
 |
|---|
| ChTry MSlow |
 |
|---|
| ArgC MSlow |
 |
|---|
| LysN MSlow |
 |
|---|
| TryLysC MSlow |
 |
|---|
| Try MShigh |
 |
|---|
| ChTry MShigh |
 |
|---|
| ArgC MShigh |
 |
|---|
| LysN MShigh |
 |
|---|
| TryLysC MShigh |
 |
|---|
General Statistics
Number of major isoforms |
Number of additional isoforms |
Number of all proteins |
Number of amino acids |
Min. Seq. Length |
Max. Seq. Length |
Avg. Seq. Length |
Avg. Mol. Weight |
|---|---|---|---|---|---|---|---|
0 |
980990 |
30 |
1735 |
287.4 |
31.36 |
Amino acid frequency
Ala |
Cys |
Asp |
Glu |
Phe |
Gly |
His |
Ile |
Lys |
Leu |
|---|---|---|---|---|---|---|---|---|---|
10.535 ± 0.055 | 0.768 ± 0.016 |
7.78 ± 0.045 | 8.94 ± 0.054 |
3.395 ± 0.026 | 8.392 ± 0.042 |
2.097 ± 0.023 | 4.123 ± 0.032 |
2.194 ± 0.025 | 9.053 ± 0.054 |
Met |
Asn |
Gln |
Pro |
Arg |
Ser |
Thr |
Val |
Trp |
Tyr |
|---|---|---|---|---|---|---|---|---|---|
1.799 ± 0.018 | 2.597 ± 0.024 |
4.659 ± 0.027 | 2.873 ± 0.022 |
6.338 ± 0.039 | 5.653 ± 0.026 |
6.348 ± 0.033 | 8.58 ± 0.041 |
1.167 ± 0.016 | 2.708 ± 0.024 |
Most of the basic statistics you can see at this page can be downloaded from this CSV file
Proteome-pI is available under Creative Commons Attribution-NoDerivs license, for more details see here
| Reference: Kozlowski LP. Proteome-pI 2.0: Proteome Isoelectric Point Database Update. Nucleic Acids Res. 2021, doi: 10.1093/nar/gkab944 | Contact: Lukasz P. Kozlowski |
