Thiomonas sp. X19
Taxonomy: cellular organisms; Bacteria; Proteobacteria; Betaproteobacteria; Burkholderiales; Burkholderiales genera incertae sedis; Thiomonas; unclassified Thiomonas
Average proteome isoelectric point is 7.31
Get precalculated fractions of proteins

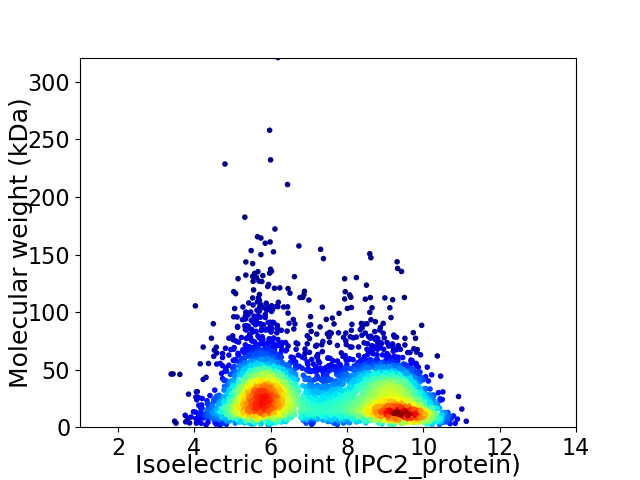
Virtual 2D-PAGE plot for 4745 proteins (isoelectric point calculated using IPC2_protein)
Get csv file with sequences according to given criteria:
* You can choose from 21 different methods for calculating isoelectric point
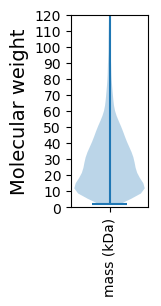
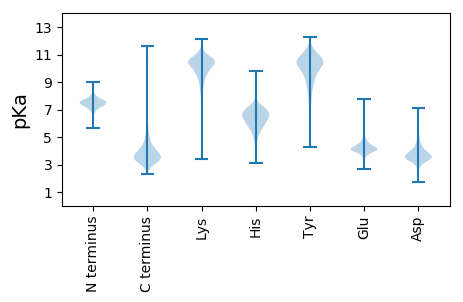
Summary statistics related to proteome-wise predictions


Protein with the lowest isoelectric point:
>tr|A0A238DU23|A0A238DU23_9BURK Single-strand binding protein/Primosomal replication protein n OS=Thiomonas sp. X19 OX=1050370 GN=THIX_70036 PE=4 SV=1
MM1 pKa = 7.56RR2 pKa = 11.84QTLLAAALAALPFLASPLALAQTLPPAPAPVPDD35 pKa = 4.16AQTTMRR41 pKa = 11.84TAATQNGSSAYY52 pKa = 9.33SGGMAYY58 pKa = 10.2FDD60 pKa = 3.32QQAYY64 pKa = 9.6QDD66 pKa = 4.07AANTAQDD73 pKa = 3.98IANQDD78 pKa = 3.17AANASSGGYY87 pKa = 9.73GVGLSGSTAWQDD99 pKa = 3.32AAAQAQGVANDD110 pKa = 3.56QQNLVDD116 pKa = 3.97AQVTVQQQGSSSQAGAYY133 pKa = 7.85STEE136 pKa = 4.34SAQAPVVAQNDD147 pKa = 3.09NSAAQTSASSGEE159 pKa = 4.27SASNASITQSTGVPQGQPTVTNNTAEE185 pKa = 4.11YY186 pKa = 9.27LAAGAATQAMMSGEE200 pKa = 4.09ATDD203 pKa = 5.93GYY205 pKa = 10.92QSNIDD210 pKa = 3.45AYY212 pKa = 9.96KK213 pKa = 10.7AALQAAAXILGAVAGGIAGSAAEE236 pKa = 4.23GAATRR241 pKa = 11.84EE242 pKa = 3.88QGLQITVRR250 pKa = 11.84LDD252 pKa = 3.32DD253 pKa = 4.24GQAIAVTQAADD264 pKa = 3.25VQLAVGQRR272 pKa = 11.84VEE274 pKa = 4.65IIGNLYY280 pKa = 9.64GGKK283 pKa = 10.13ARR285 pKa = 11.84VLPMGG290 pKa = 4.05
MM1 pKa = 7.56RR2 pKa = 11.84QTLLAAALAALPFLASPLALAQTLPPAPAPVPDD35 pKa = 4.16AQTTMRR41 pKa = 11.84TAATQNGSSAYY52 pKa = 9.33SGGMAYY58 pKa = 10.2FDD60 pKa = 3.32QQAYY64 pKa = 9.6QDD66 pKa = 4.07AANTAQDD73 pKa = 3.98IANQDD78 pKa = 3.17AANASSGGYY87 pKa = 9.73GVGLSGSTAWQDD99 pKa = 3.32AAAQAQGVANDD110 pKa = 3.56QQNLVDD116 pKa = 3.97AQVTVQQQGSSSQAGAYY133 pKa = 7.85STEE136 pKa = 4.34SAQAPVVAQNDD147 pKa = 3.09NSAAQTSASSGEE159 pKa = 4.27SASNASITQSTGVPQGQPTVTNNTAEE185 pKa = 4.11YY186 pKa = 9.27LAAGAATQAMMSGEE200 pKa = 4.09ATDD203 pKa = 5.93GYY205 pKa = 10.92QSNIDD210 pKa = 3.45AYY212 pKa = 9.96KK213 pKa = 10.7AALQAAAXILGAVAGGIAGSAAEE236 pKa = 4.23GAATRR241 pKa = 11.84EE242 pKa = 3.88QGLQITVRR250 pKa = 11.84LDD252 pKa = 3.32DD253 pKa = 4.24GQAIAVTQAADD264 pKa = 3.25VQLAVGQRR272 pKa = 11.84VEE274 pKa = 4.65IIGNLYY280 pKa = 9.64GGKK283 pKa = 10.13ARR285 pKa = 11.84VLPMGG290 pKa = 4.05
Molecular weight: 28.67 kDa
Isoelectric point according different methods:
Protein with the highest isoelectric point:
>tr|A0A238DK27|A0A238DK27_9BURK Transcriptional regulator LysR family OS=Thiomonas sp. X19 OX=1050370 GN=THIX_110122 PE=3 SV=1
MM1 pKa = 7.15TRR3 pKa = 11.84TVTRR7 pKa = 11.84KK8 pKa = 9.62GVQARR13 pKa = 11.84LTSRR17 pKa = 11.84IRR19 pKa = 11.84NSSTMAPKK27 pKa = 10.07VATMRR32 pKa = 11.84LGRR35 pKa = 11.84MPPPGNKK42 pKa = 8.78PSRR45 pKa = 11.84RR46 pKa = 11.84KK47 pKa = 9.73RR48 pKa = 11.84KK49 pKa = 8.86PPRR52 pKa = 11.84KK53 pKa = 9.79APTTPTTKK61 pKa = 10.19SPRR64 pKa = 11.84RR65 pKa = 11.84PKK67 pKa = 10.04PLPLVIFPANQPAMMPMMRR86 pKa = 11.84KK87 pKa = 9.27PIKK90 pKa = 10.75LMVFPLGQVQLAAGKK105 pKa = 10.01FPGLIRR111 pKa = 11.84RR112 pKa = 11.84SLEE115 pKa = 3.6AVAVNRR121 pKa = 11.84KK122 pKa = 8.5HH123 pKa = 6.5DD124 pKa = 3.87HH125 pKa = 6.55SIVPATWLKK134 pKa = 10.65ARR136 pKa = 11.84SARR139 pKa = 11.84RR140 pKa = 11.84AA141 pKa = 3.23
MM1 pKa = 7.15TRR3 pKa = 11.84TVTRR7 pKa = 11.84KK8 pKa = 9.62GVQARR13 pKa = 11.84LTSRR17 pKa = 11.84IRR19 pKa = 11.84NSSTMAPKK27 pKa = 10.07VATMRR32 pKa = 11.84LGRR35 pKa = 11.84MPPPGNKK42 pKa = 8.78PSRR45 pKa = 11.84RR46 pKa = 11.84KK47 pKa = 9.73RR48 pKa = 11.84KK49 pKa = 8.86PPRR52 pKa = 11.84KK53 pKa = 9.79APTTPTTKK61 pKa = 10.19SPRR64 pKa = 11.84RR65 pKa = 11.84PKK67 pKa = 10.04PLPLVIFPANQPAMMPMMRR86 pKa = 11.84KK87 pKa = 9.27PIKK90 pKa = 10.75LMVFPLGQVQLAAGKK105 pKa = 10.01FPGLIRR111 pKa = 11.84RR112 pKa = 11.84SLEE115 pKa = 3.6AVAVNRR121 pKa = 11.84KK122 pKa = 8.5HH123 pKa = 6.5DD124 pKa = 3.87HH125 pKa = 6.55SIVPATWLKK134 pKa = 10.65ARR136 pKa = 11.84SARR139 pKa = 11.84RR140 pKa = 11.84AA141 pKa = 3.23
Molecular weight: 15.78 kDa
Isoelectric point according different methods:
Peptides (in silico digests for buttom-up proteomics)
Below you can find in silico digests of the whole proteome with Trypsin, Chymotrypsin, Trypsin+LysC, LysN, ArgC proteases suitable for different mass spec machines.| Try ESI |
 |
|---|
| ChTry ESI |
 |
|---|
| ArgC ESI |
 |
|---|
| LysN ESI |
 |
|---|
| TryLysC ESI |
 |
|---|
| Try MALDI |
 |
|---|
| ChTry MALDI |
 |
|---|
| ArgC MALDI |
 |
|---|
| LysN MALDI |
 |
|---|
| TryLysC MALDI |
 |
|---|
| Try LTQ |
 |
|---|
| ChTry LTQ |
 |
|---|
| ArgC LTQ |
 |
|---|
| LysN LTQ |
 |
|---|
| TryLysC LTQ |
 |
|---|
| Try MSlow |
 |
|---|
| ChTry MSlow |
 |
|---|
| ArgC MSlow |
 |
|---|
| LysN MSlow |
 |
|---|
| TryLysC MSlow |
 |
|---|
| Try MShigh |
 |
|---|
| ChTry MShigh |
 |
|---|
| ArgC MShigh |
 |
|---|
| LysN MShigh |
 |
|---|
| TryLysC MShigh |
 |
|---|
General Statistics
Number of major isoforms |
Number of additional isoforms |
Number of all proteins |
Number of amino acids |
Min. Seq. Length |
Max. Seq. Length |
Avg. Seq. Length |
Avg. Mol. Weight |
|---|---|---|---|---|---|---|---|
0 |
1333605 |
20 |
2926 |
281.1 |
30.5 |
Amino acid frequency
Ala |
Cys |
Asp |
Glu |
Phe |
Gly |
His |
Ile |
Lys |
Leu |
|---|---|---|---|---|---|---|---|---|---|
13.294 ± 0.054 | 1.003 ± 0.015 |
5.021 ± 0.025 | 4.709 ± 0.033 |
3.323 ± 0.026 | 8.179 ± 0.038 |
2.567 ± 0.018 | 4.253 ± 0.03 |
2.999 ± 0.03 | 11.021 ± 0.053 |
Met |
Asn |
Gln |
Pro |
Arg |
Ser |
Thr |
Val |
Trp |
Tyr |
|---|---|---|---|---|---|---|---|---|---|
2.482 ± 0.02 | 2.481 ± 0.024 |
5.602 ± 0.032 | 4.64 ± 0.028 |
7.214 ± 0.039 | 5.425 ± 0.028 |
5.033 ± 0.028 | 7.095 ± 0.029 |
1.565 ± 0.018 | 2.093 ± 0.019 |
Most of the basic statistics you can see at this page can be downloaded from this CSV file
Proteome-pI is available under Creative Commons Attribution-NoDerivs license, for more details see here
| Reference: Kozlowski LP. Proteome-pI 2.0: Proteome Isoelectric Point Database Update. Nucleic Acids Res. 2021, doi: 10.1093/nar/gkab944 | Contact: Lukasz P. Kozlowski |
