Fusarium oxysporum f. sp. lycopersici (strain 4287 / CBS 123668 / FGSC 9935 / NRRL 34936) (Fusarium vascular wilt of tomato)
Taxonomy: cellular organisms; Eukaryota; Opisthokonta; Fungi; Dikarya; Ascomycota; saccharomyceta; Pezizomycotina; leotiomyceta; sordariomyceta; Sordariomycetes; Hypocreomycetidae; Hypocreales; Nectriaceae; Fusarium; Fusarium oxysporum species complex; Fusarium oxysporum; Fusarium oxysporum f. sp. lycopersici
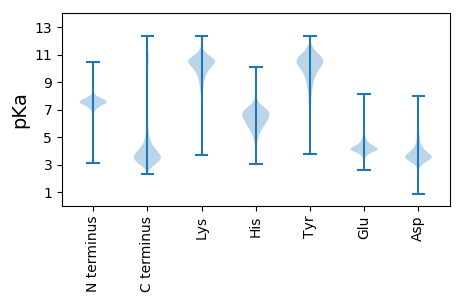
Average proteome isoelectric point is 6.38
Get precalculated fractions of proteins

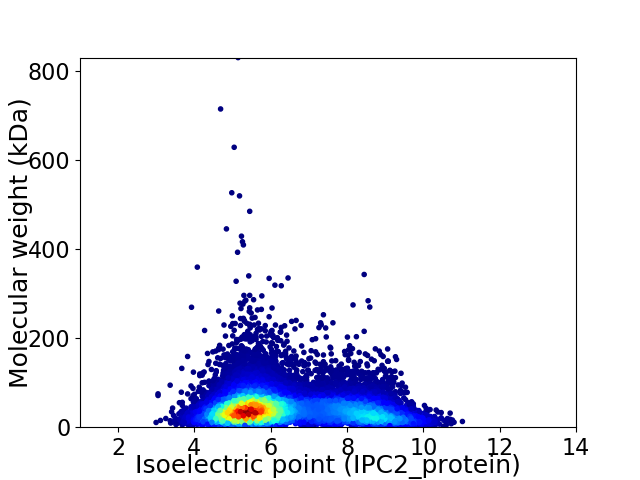
Virtual 2D-PAGE plot for 16646 proteins (isoelectric point calculated using IPC2_protein)
Get csv file with sequences according to given criteria:
* You can choose from 21 different methods for calculating isoelectric point
Summary statistics related to proteome-wise predictions


Protein with the lowest isoelectric point:
>tr|A0A0D2XVT7|A0A0D2XVT7_FUSO4 Uncharacterized protein OS=Fusarium oxysporum f. sp. lycopersici (strain 4287 / CBS 123668 / FGSC 9935 / NRRL 34936) OX=426428 GN=FOXG_08099 PE=3 SV=1
MM1 pKa = 7.52KK2 pKa = 10.48SSFLTIFGLAAAAVAQSSDD21 pKa = 4.31DD22 pKa = 3.79LPQCGRR28 pKa = 11.84TCAGNMVSAEE38 pKa = 3.88KK39 pKa = 10.54SQEE42 pKa = 4.08LGCDD46 pKa = 3.26AGDD49 pKa = 3.95IGCLCTNQNFIYY61 pKa = 10.55GLRR64 pKa = 11.84DD65 pKa = 3.29CSAAICNGEE74 pKa = 3.94QAAQVLNYY82 pKa = 10.16GLEE85 pKa = 3.7ICRR88 pKa = 11.84RR89 pKa = 11.84AGVQITTGASGEE101 pKa = 4.25VSATATGSGAVRR113 pKa = 11.84TVLSTLTSGDD123 pKa = 3.52STITSALSTISGTATGASDD142 pKa = 3.87DD143 pKa = 4.25VSVSTYY149 pKa = 10.66TSVLTNSEE157 pKa = 3.75GDD159 pKa = 3.34EE160 pKa = 4.06FTTTGKK166 pKa = 10.59AILGGAVVTTFTSGGSTIVSTITSGSEE193 pKa = 4.06TEE195 pKa = 4.1TSGAEE200 pKa = 4.08SAEE203 pKa = 4.19VTTFTSDD210 pKa = 2.47GTEE213 pKa = 3.58IVRR216 pKa = 11.84TLVTEE221 pKa = 4.3TASTDD226 pKa = 3.35SAASAEE232 pKa = 4.45VTTFTTDD239 pKa = 2.54GTEE242 pKa = 4.14VVRR245 pKa = 11.84TLTTVTSGSQSEE257 pKa = 4.77SVSEE261 pKa = 4.31TVTDD265 pKa = 3.84ASTATEE271 pKa = 4.36GATSATGTDD280 pKa = 3.55ASATTTGTDD289 pKa = 3.02NAAAAQMTGAPAGVIAAAGIAMLLLL314 pKa = 4.24
MM1 pKa = 7.52KK2 pKa = 10.48SSFLTIFGLAAAAVAQSSDD21 pKa = 4.31DD22 pKa = 3.79LPQCGRR28 pKa = 11.84TCAGNMVSAEE38 pKa = 3.88KK39 pKa = 10.54SQEE42 pKa = 4.08LGCDD46 pKa = 3.26AGDD49 pKa = 3.95IGCLCTNQNFIYY61 pKa = 10.55GLRR64 pKa = 11.84DD65 pKa = 3.29CSAAICNGEE74 pKa = 3.94QAAQVLNYY82 pKa = 10.16GLEE85 pKa = 3.7ICRR88 pKa = 11.84RR89 pKa = 11.84AGVQITTGASGEE101 pKa = 4.25VSATATGSGAVRR113 pKa = 11.84TVLSTLTSGDD123 pKa = 3.52STITSALSTISGTATGASDD142 pKa = 3.87DD143 pKa = 4.25VSVSTYY149 pKa = 10.66TSVLTNSEE157 pKa = 3.75GDD159 pKa = 3.34EE160 pKa = 4.06FTTTGKK166 pKa = 10.59AILGGAVVTTFTSGGSTIVSTITSGSEE193 pKa = 4.06TEE195 pKa = 4.1TSGAEE200 pKa = 4.08SAEE203 pKa = 4.19VTTFTSDD210 pKa = 2.47GTEE213 pKa = 3.58IVRR216 pKa = 11.84TLVTEE221 pKa = 4.3TASTDD226 pKa = 3.35SAASAEE232 pKa = 4.45VTTFTTDD239 pKa = 2.54GTEE242 pKa = 4.14VVRR245 pKa = 11.84TLTTVTSGSQSEE257 pKa = 4.77SVSEE261 pKa = 4.31TVTDD265 pKa = 3.84ASTATEE271 pKa = 4.36GATSATGTDD280 pKa = 3.55ASATTTGTDD289 pKa = 3.02NAAAAQMTGAPAGVIAAAGIAMLLLL314 pKa = 4.24
Molecular weight: 30.88 kDa
Isoelectric point according different methods:
Protein with the highest isoelectric point:
>tr|A0A0D2XNR3|A0A0D2XNR3_FUSO4 Uncharacterized protein OS=Fusarium oxysporum f. sp. lycopersici (strain 4287 / CBS 123668 / FGSC 9935 / NRRL 34936) OX=426428 PE=4 SV=1
MM1 pKa = 7.86PLTRR5 pKa = 11.84THH7 pKa = 6.63RR8 pKa = 11.84HH9 pKa = 4.04TAPRR13 pKa = 11.84RR14 pKa = 11.84SIFSTRR20 pKa = 11.84RR21 pKa = 11.84RR22 pKa = 11.84APAHH26 pKa = 4.84SHH28 pKa = 5.33RR29 pKa = 11.84HH30 pKa = 4.03TTTTTTTTTKK40 pKa = 9.5PRR42 pKa = 11.84RR43 pKa = 11.84RR44 pKa = 11.84GMFGGGAGRR53 pKa = 11.84RR54 pKa = 11.84THH56 pKa = 6.46ATTTAPVHH64 pKa = 4.87HH65 pKa = 6.63HH66 pKa = 5.14QRR68 pKa = 11.84RR69 pKa = 11.84PSMKK73 pKa = 10.02DD74 pKa = 2.95KK75 pKa = 11.41VSGALLKK82 pKa = 11.04LKK84 pKa = 10.68GSLTRR89 pKa = 11.84RR90 pKa = 11.84PGVKK94 pKa = 9.89AAGTRR99 pKa = 11.84RR100 pKa = 11.84MRR102 pKa = 11.84GTDD105 pKa = 3.02GRR107 pKa = 11.84GARR110 pKa = 11.84HH111 pKa = 5.87HH112 pKa = 7.23RR113 pKa = 11.84YY114 pKa = 9.44
MM1 pKa = 7.86PLTRR5 pKa = 11.84THH7 pKa = 6.63RR8 pKa = 11.84HH9 pKa = 4.04TAPRR13 pKa = 11.84RR14 pKa = 11.84SIFSTRR20 pKa = 11.84RR21 pKa = 11.84RR22 pKa = 11.84APAHH26 pKa = 4.84SHH28 pKa = 5.33RR29 pKa = 11.84HH30 pKa = 4.03TTTTTTTTTKK40 pKa = 9.5PRR42 pKa = 11.84RR43 pKa = 11.84RR44 pKa = 11.84GMFGGGAGRR53 pKa = 11.84RR54 pKa = 11.84THH56 pKa = 6.46ATTTAPVHH64 pKa = 4.87HH65 pKa = 6.63HH66 pKa = 5.14QRR68 pKa = 11.84RR69 pKa = 11.84PSMKK73 pKa = 10.02DD74 pKa = 2.95KK75 pKa = 11.41VSGALLKK82 pKa = 11.04LKK84 pKa = 10.68GSLTRR89 pKa = 11.84RR90 pKa = 11.84PGVKK94 pKa = 9.89AAGTRR99 pKa = 11.84RR100 pKa = 11.84MRR102 pKa = 11.84GTDD105 pKa = 3.02GRR107 pKa = 11.84GARR110 pKa = 11.84HH111 pKa = 5.87HH112 pKa = 7.23RR113 pKa = 11.84YY114 pKa = 9.44
Molecular weight: 12.82 kDa
Isoelectric point according different methods:
Peptides (in silico digests for buttom-up proteomics)
Below you can find in silico digests of the whole proteome with Trypsin, Chymotrypsin, Trypsin+LysC, LysN, ArgC proteases suitable for different mass spec machines.| Try ESI |
 |
|---|
| ChTry ESI |
 |
|---|
| ArgC ESI |
 |
|---|
| LysN ESI |
 |
|---|
| TryLysC ESI |
 |
|---|
| Try MALDI |
 |
|---|
| ChTry MALDI |
 |
|---|
| ArgC MALDI |
 |
|---|
| LysN MALDI |
 |
|---|
| TryLysC MALDI |
 |
|---|
| Try LTQ |
 |
|---|
| ChTry LTQ |
 |
|---|
| ArgC LTQ |
 |
|---|
| LysN LTQ |
 |
|---|
| TryLysC LTQ |
 |
|---|
| Try MSlow |
 |
|---|
| ChTry MSlow |
 |
|---|
| ArgC MSlow |
 |
|---|
| LysN MSlow |
 |
|---|
| TryLysC MSlow |
 |
|---|
| Try MShigh |
 |
|---|
| ChTry MShigh |
 |
|---|
| ArgC MShigh |
 |
|---|
| LysN MShigh |
 |
|---|
| TryLysC MShigh |
 |
|---|
General Statistics
Number of major isoforms |
Number of additional isoforms |
Number of all proteins |
Number of amino acids |
Min. Seq. Length |
Max. Seq. Length |
Avg. Seq. Length |
Avg. Mol. Weight |
|---|---|---|---|---|---|---|---|
6886139 |
13 |
7531 |
413.7 |
45.9 |
Amino acid frequency
Ala |
Cys |
Asp |
Glu |
Phe |
Gly |
His |
Ile |
Lys |
Leu |
|---|---|---|---|---|---|---|---|---|---|
8.416 ± 0.015 | 1.274 ± 0.007 |
5.86 ± 0.017 | 6.256 ± 0.021 |
3.786 ± 0.011 | 6.873 ± 0.019 |
2.36 ± 0.008 | 5.121 ± 0.013 |
5.105 ± 0.016 | 8.777 ± 0.02 |
Met |
Asn |
Gln |
Pro |
Arg |
Ser |
Thr |
Val |
Trp |
Tyr |
|---|---|---|---|---|---|---|---|---|---|
2.266 ± 0.008 | 3.788 ± 0.011 |
5.811 ± 0.02 | 3.998 ± 0.015 |
5.868 ± 0.017 | 7.95 ± 0.019 |
5.945 ± 0.019 | 6.154 ± 0.014 |
1.56 ± 0.007 | 2.831 ± 0.01 |
Most of the basic statistics you can see at this page can be downloaded from this CSV file
Proteome-pI is available under Creative Commons Attribution-NoDerivs license, for more details see here
| Reference: Kozlowski LP. Proteome-pI 2.0: Proteome Isoelectric Point Database Update. Nucleic Acids Res. 2021, doi: 10.1093/nar/gkab944 | Contact: Lukasz P. Kozlowski |
