Paraburkholderia sp. DHOC27
Taxonomy: cellular organisms; Bacteria; Proteobacteria; Betaproteobacteria; Burkholderiales; Burkholderiaceae; Paraburkholderia; unclassified Paraburkholderia
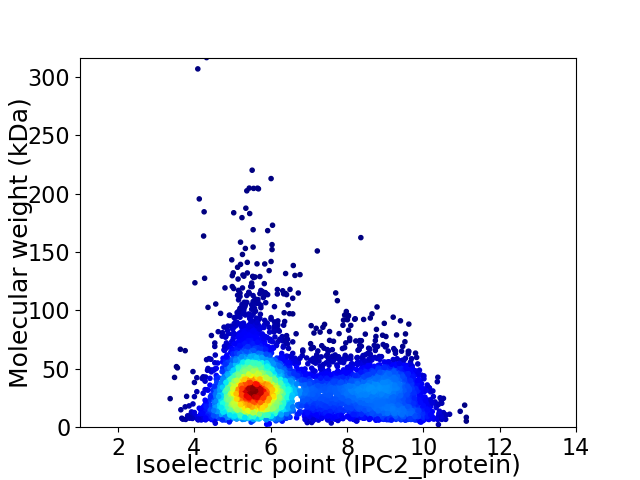
Average proteome isoelectric point is 6.56
Get precalculated fractions of proteins

Virtual 2D-PAGE plot for 6264 proteins (isoelectric point calculated using IPC2_protein)
Get csv file with sequences according to given criteria:
* You can choose from 21 different methods for calculating isoelectric point
Summary statistics related to proteome-wise predictions


Protein with the lowest isoelectric point:
>tr|A0A372K7M5|A0A372K7M5_9BURK Uncharacterized protein OS=Paraburkholderia sp. DHOC27 OX=2303330 GN=D0B32_00095 PE=4 SV=1
MM1 pKa = 7.77KK2 pKa = 9.82IGSISGIAQLSLSASLAFSLAACGGGGGSSASTSNQPVTAAATSMTGTVAIGTALTGATVTVTDD66 pKa = 4.37ANGKK70 pKa = 6.06TVSAASGANGAYY82 pKa = 9.73SVSLTGLSAPLLITAADD99 pKa = 3.86PSGVSGTLYY108 pKa = 10.75SVVASTNTTSGAPVTANATPLTTAVAALMTQSGNPADD145 pKa = 3.93LAGNASAITSSAITAAEE162 pKa = 4.18TTLDD166 pKa = 3.66SAIAPILSANSVPASFDD183 pKa = 4.17PIGTTFTPNQTGADD197 pKa = 3.51AVIDD201 pKa = 4.13SVAVTPSASGSGFQITSLANPNTAIQLNSSTSVSTALVAPAQAANYY247 pKa = 8.18LASLQASLSACASDD261 pKa = 3.99VQGGATDD268 pKa = 3.88TSDD271 pKa = 4.11SNCMSAIDD279 pKa = 5.05ANYY282 pKa = 9.93LNNGVGTGVAGFAKK296 pKa = 10.02RR297 pKa = 11.84HH298 pKa = 4.92SLFTKK303 pKa = 9.03GTVLTGIKK311 pKa = 9.41TIAFVPAGTLAGISNPAALVYY332 pKa = 11.0LLMIDD337 pKa = 4.14PDD339 pKa = 3.92GTPDD343 pKa = 3.21FGMDD347 pKa = 3.71YY348 pKa = 10.74VQQLPNGKK356 pKa = 8.37WDD358 pKa = 3.71VIGNQLQDD366 pKa = 3.18GTYY369 pKa = 9.19IASFLGRR376 pKa = 11.84VQYY379 pKa = 10.48TDD381 pKa = 3.32SADD384 pKa = 3.27AGNAHH389 pKa = 6.4YY390 pKa = 10.43EE391 pKa = 4.19SGLDD395 pKa = 3.47VQIPSSVKK403 pKa = 9.8VNGTATSVGSAVVTGPGLPTNGLWFQSAANGTGAGYY439 pKa = 10.93LDD441 pKa = 4.62IPTGTLTAPLTSTGNRR457 pKa = 11.84VNGGMSTTYY466 pKa = 9.45KK467 pKa = 9.53WAWAPVSGGTTSFSPSGLPEE487 pKa = 4.08YY488 pKa = 10.56ASSSQDD494 pKa = 2.86VSAITNFGIYY504 pKa = 9.18TVTLYY509 pKa = 8.99DD510 pKa = 3.43TTGTEE515 pKa = 3.83IGSEE519 pKa = 4.03QIQNIARR526 pKa = 11.84NYY528 pKa = 8.75AAAAGSTVTWQTLGNDD544 pKa = 3.97VIANYY549 pKa = 7.53LTPGGSGTQSAPGTSTALDD568 pKa = 3.44WATPAGSFYY577 pKa = 10.54PNFWASINSLGVAQASIPATTYY599 pKa = 11.1DD600 pKa = 3.26ATVWGASTGNTPSPLTFSTSFTDD623 pKa = 3.49VLTSTATATAEE634 pKa = 4.03QAVQVQLGWQADD646 pKa = 3.58GEE648 pKa = 5.02YY649 pKa = 10.85YY650 pKa = 10.97VNTWQYY656 pKa = 11.4GNPP659 pKa = 3.6
MM1 pKa = 7.77KK2 pKa = 9.82IGSISGIAQLSLSASLAFSLAACGGGGGSSASTSNQPVTAAATSMTGTVAIGTALTGATVTVTDD66 pKa = 4.37ANGKK70 pKa = 6.06TVSAASGANGAYY82 pKa = 9.73SVSLTGLSAPLLITAADD99 pKa = 3.86PSGVSGTLYY108 pKa = 10.75SVVASTNTTSGAPVTANATPLTTAVAALMTQSGNPADD145 pKa = 3.93LAGNASAITSSAITAAEE162 pKa = 4.18TTLDD166 pKa = 3.66SAIAPILSANSVPASFDD183 pKa = 4.17PIGTTFTPNQTGADD197 pKa = 3.51AVIDD201 pKa = 4.13SVAVTPSASGSGFQITSLANPNTAIQLNSSTSVSTALVAPAQAANYY247 pKa = 8.18LASLQASLSACASDD261 pKa = 3.99VQGGATDD268 pKa = 3.88TSDD271 pKa = 4.11SNCMSAIDD279 pKa = 5.05ANYY282 pKa = 9.93LNNGVGTGVAGFAKK296 pKa = 10.02RR297 pKa = 11.84HH298 pKa = 4.92SLFTKK303 pKa = 9.03GTVLTGIKK311 pKa = 9.41TIAFVPAGTLAGISNPAALVYY332 pKa = 11.0LLMIDD337 pKa = 4.14PDD339 pKa = 3.92GTPDD343 pKa = 3.21FGMDD347 pKa = 3.71YY348 pKa = 10.74VQQLPNGKK356 pKa = 8.37WDD358 pKa = 3.71VIGNQLQDD366 pKa = 3.18GTYY369 pKa = 9.19IASFLGRR376 pKa = 11.84VQYY379 pKa = 10.48TDD381 pKa = 3.32SADD384 pKa = 3.27AGNAHH389 pKa = 6.4YY390 pKa = 10.43EE391 pKa = 4.19SGLDD395 pKa = 3.47VQIPSSVKK403 pKa = 9.8VNGTATSVGSAVVTGPGLPTNGLWFQSAANGTGAGYY439 pKa = 10.93LDD441 pKa = 4.62IPTGTLTAPLTSTGNRR457 pKa = 11.84VNGGMSTTYY466 pKa = 9.45KK467 pKa = 9.53WAWAPVSGGTTSFSPSGLPEE487 pKa = 4.08YY488 pKa = 10.56ASSSQDD494 pKa = 2.86VSAITNFGIYY504 pKa = 9.18TVTLYY509 pKa = 8.99DD510 pKa = 3.43TTGTEE515 pKa = 3.83IGSEE519 pKa = 4.03QIQNIARR526 pKa = 11.84NYY528 pKa = 8.75AAAAGSTVTWQTLGNDD544 pKa = 3.97VIANYY549 pKa = 7.53LTPGGSGTQSAPGTSTALDD568 pKa = 3.44WATPAGSFYY577 pKa = 10.54PNFWASINSLGVAQASIPATTYY599 pKa = 11.1DD600 pKa = 3.26ATVWGASTGNTPSPLTFSTSFTDD623 pKa = 3.49VLTSTATATAEE634 pKa = 4.03QAVQVQLGWQADD646 pKa = 3.58GEE648 pKa = 5.02YY649 pKa = 10.85YY650 pKa = 10.97VNTWQYY656 pKa = 11.4GNPP659 pKa = 3.6
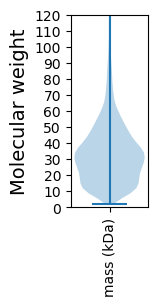
Molecular weight: 65.52 kDa
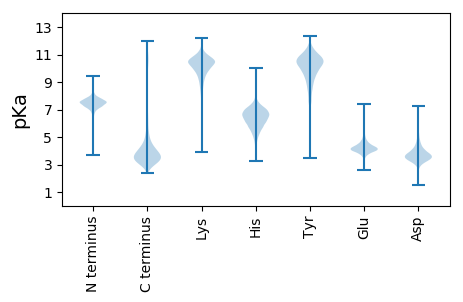
Isoelectric point according different methods:
Protein with the highest isoelectric point:
>tr|A0A372KAU9|A0A372KAU9_9BURK MFS transporter OS=Paraburkholderia sp. DHOC27 OX=2303330 GN=D0B32_02345 PE=4 SV=1
MM1 pKa = 7.24AAIVEE6 pKa = 4.48FRR8 pKa = 11.84APGRR12 pKa = 11.84RR13 pKa = 11.84GRR15 pKa = 11.84RR16 pKa = 11.84VVGHH20 pKa = 6.7AVPGVGLRR28 pKa = 11.84VRR30 pKa = 11.84RR31 pKa = 11.84TARR34 pKa = 11.84QGVGRR39 pKa = 11.84MLRR42 pKa = 11.84QSVRR46 pKa = 11.84RR47 pKa = 11.84MLRR50 pKa = 11.84RR51 pKa = 11.84VLGQMPRR58 pKa = 11.84QGLRR62 pKa = 11.84QRR64 pKa = 11.84LSHH67 pKa = 7.07PAPQGLFPP75 pKa = 5.6
MM1 pKa = 7.24AAIVEE6 pKa = 4.48FRR8 pKa = 11.84APGRR12 pKa = 11.84RR13 pKa = 11.84GRR15 pKa = 11.84RR16 pKa = 11.84VVGHH20 pKa = 6.7AVPGVGLRR28 pKa = 11.84VRR30 pKa = 11.84RR31 pKa = 11.84TARR34 pKa = 11.84QGVGRR39 pKa = 11.84MLRR42 pKa = 11.84QSVRR46 pKa = 11.84RR47 pKa = 11.84MLRR50 pKa = 11.84RR51 pKa = 11.84VLGQMPRR58 pKa = 11.84QGLRR62 pKa = 11.84QRR64 pKa = 11.84LSHH67 pKa = 7.07PAPQGLFPP75 pKa = 5.6
Molecular weight: 8.47 kDa
Isoelectric point according different methods:
Peptides (in silico digests for buttom-up proteomics)
Below you can find in silico digests of the whole proteome with Trypsin, Chymotrypsin, Trypsin+LysC, LysN, ArgC proteases suitable for different mass spec machines.| Try ESI |
 |
|---|
| ChTry ESI |
 |
|---|
| ArgC ESI |
 |
|---|
| LysN ESI |
 |
|---|
| TryLysC ESI |
 |
|---|
| Try MALDI |
 |
|---|
| ChTry MALDI |
 |
|---|
| ArgC MALDI |
 |
|---|
| LysN MALDI |
 |
|---|
| TryLysC MALDI |
 |
|---|
| Try LTQ |
 |
|---|
| ChTry LTQ |
 |
|---|
| ArgC LTQ |
 |
|---|
| LysN LTQ |
 |
|---|
| TryLysC LTQ |
 |
|---|
| Try MSlow |
 |
|---|
| ChTry MSlow |
 |
|---|
| ArgC MSlow |
 |
|---|
| LysN MSlow |
 |
|---|
| TryLysC MSlow |
 |
|---|
| Try MShigh |
 |
|---|
| ChTry MShigh |
 |
|---|
| ArgC MShigh |
 |
|---|
| LysN MShigh |
 |
|---|
| TryLysC MShigh |
 |
|---|
General Statistics
Number of major isoforms |
Number of additional isoforms |
Number of all proteins |
Number of amino acids |
Min. Seq. Length |
Max. Seq. Length |
Avg. Seq. Length |
Avg. Mol. Weight |
|---|---|---|---|---|---|---|---|
0 |
2023864 |
19 |
3196 |
323.1 |
35.05 |
Amino acid frequency
Ala |
Cys |
Asp |
Glu |
Phe |
Gly |
His |
Ile |
Lys |
Leu |
|---|---|---|---|---|---|---|---|---|---|
12.663 ± 0.043 | 0.909 ± 0.009 |
5.358 ± 0.022 | 5.162 ± 0.033 |
3.701 ± 0.024 | 8.08 ± 0.034 |
2.367 ± 0.016 | 4.703 ± 0.02 |
3.035 ± 0.022 | 10.293 ± 0.035 |
Met |
Asn |
Gln |
Pro |
Arg |
Ser |
Thr |
Val |
Trp |
Tyr |
|---|---|---|---|---|---|---|---|---|---|
2.354 ± 0.015 | 2.877 ± 0.025 |
5.083 ± 0.024 | 3.757 ± 0.023 |
6.665 ± 0.036 | 5.812 ± 0.027 |
5.595 ± 0.03 | 7.792 ± 0.027 |
1.372 ± 0.013 | 2.423 ± 0.017 |
Most of the basic statistics you can see at this page can be downloaded from this CSV file
Proteome-pI is available under Creative Commons Attribution-NoDerivs license, for more details see here
| Reference: Kozlowski LP. Proteome-pI 2.0: Proteome Isoelectric Point Database Update. Nucleic Acids Res. 2021, doi: 10.1093/nar/gkab944 | Contact: Lukasz P. Kozlowski |
