Beet necrotic yellow vein virus (isolate Japan/S) (BNYVV)
Taxonomy: Viruses; Riboviria; Orthornavirae; Kitrinoviricota; Alsuviricetes; Hepelivirales; Benyviridae; Benyvirus; Beet necrotic yellow vein virus
Average proteome isoelectric point is 6.52
Get precalculated fractions of proteins

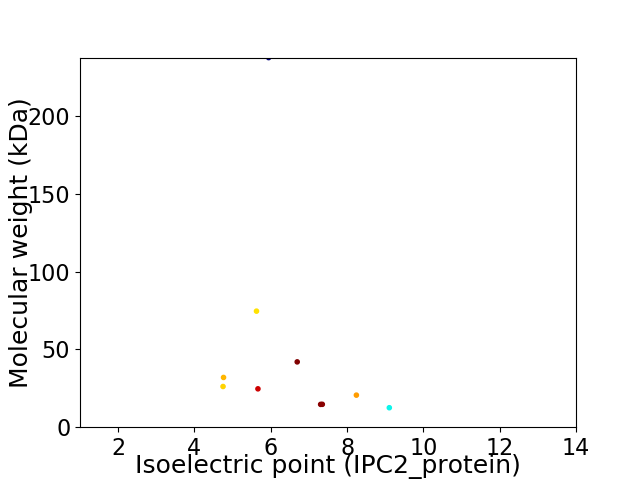
Virtual 2D-PAGE plot for 10 proteins (isoelectric point calculated using IPC2_protein)
Get csv file with sequences according to given criteria:
* You can choose from 21 different methods for calculating isoelectric point
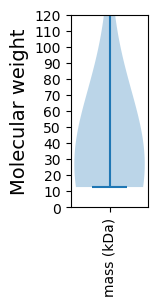
Summary statistics related to proteome-wise predictions


Protein with the lowest isoelectric point:
>sp|Q65674|TGB1_BNYVS Movement protein TGB1 OS=Beet necrotic yellow vein virus (isolate Japan/S) OX=652670 GN=ORF4 PE=3 SV=1
MM1 pKa = 7.92ADD3 pKa = 4.27GEE5 pKa = 4.3ICRR8 pKa = 11.84CQVTDD13 pKa = 3.84PPLIRR18 pKa = 11.84HH19 pKa = 6.19EE20 pKa = 6.0DD21 pKa = 3.69YY22 pKa = 11.28DD23 pKa = 3.84CTARR27 pKa = 11.84MVQKK31 pKa = 10.31RR32 pKa = 11.84IEE34 pKa = 4.12IGPLGVLLNLNMLFHH49 pKa = 7.04MSRR52 pKa = 11.84VRR54 pKa = 11.84HH55 pKa = 5.81IDD57 pKa = 3.14VYY59 pKa = 10.92PYY61 pKa = 10.66LNNIMSISVSLDD73 pKa = 3.18VPVSSGVGVGRR84 pKa = 11.84VRR86 pKa = 11.84VLIFTTSRR94 pKa = 11.84EE95 pKa = 3.95RR96 pKa = 11.84VGIFHH101 pKa = 7.32GWQVVPGCFLNAPCYY116 pKa = 10.55SGVDD120 pKa = 3.59VLSDD124 pKa = 3.7EE125 pKa = 4.59LCEE128 pKa = 4.4ANITNTSVSSVAMFNGSYY146 pKa = 9.99RR147 pKa = 11.84PEE149 pKa = 4.28DD150 pKa = 3.47VWILLLTSSTCYY162 pKa = 10.05GYY164 pKa = 10.96HH165 pKa = 6.77DD166 pKa = 3.93VVVDD170 pKa = 4.21IEE172 pKa = 4.37QCTLPSNIDD181 pKa = 3.29GCVCCSGVCYY191 pKa = 10.57FNDD194 pKa = 3.17NHH196 pKa = 6.23CFCGRR201 pKa = 11.84RR202 pKa = 11.84DD203 pKa = 3.85SNPFNPPCFQFIKK216 pKa = 10.55DD217 pKa = 3.83CNEE220 pKa = 3.88LYY222 pKa = 9.07GTNEE226 pKa = 4.07TKK228 pKa = 10.59QFICDD233 pKa = 3.88LVGDD237 pKa = 4.77DD238 pKa = 5.62NLDD241 pKa = 3.66SVNTLTKK248 pKa = 9.77EE249 pKa = 3.74GWRR252 pKa = 11.84RR253 pKa = 11.84FCDD256 pKa = 3.56VLWNTTYY263 pKa = 11.61GDD265 pKa = 3.61VEE267 pKa = 4.45SRR269 pKa = 11.84TFARR273 pKa = 11.84FLWFVFYY280 pKa = 10.94HH281 pKa = 6.88DD282 pKa = 3.8
MM1 pKa = 7.92ADD3 pKa = 4.27GEE5 pKa = 4.3ICRR8 pKa = 11.84CQVTDD13 pKa = 3.84PPLIRR18 pKa = 11.84HH19 pKa = 6.19EE20 pKa = 6.0DD21 pKa = 3.69YY22 pKa = 11.28DD23 pKa = 3.84CTARR27 pKa = 11.84MVQKK31 pKa = 10.31RR32 pKa = 11.84IEE34 pKa = 4.12IGPLGVLLNLNMLFHH49 pKa = 7.04MSRR52 pKa = 11.84VRR54 pKa = 11.84HH55 pKa = 5.81IDD57 pKa = 3.14VYY59 pKa = 10.92PYY61 pKa = 10.66LNNIMSISVSLDD73 pKa = 3.18VPVSSGVGVGRR84 pKa = 11.84VRR86 pKa = 11.84VLIFTTSRR94 pKa = 11.84EE95 pKa = 3.95RR96 pKa = 11.84VGIFHH101 pKa = 7.32GWQVVPGCFLNAPCYY116 pKa = 10.55SGVDD120 pKa = 3.59VLSDD124 pKa = 3.7EE125 pKa = 4.59LCEE128 pKa = 4.4ANITNTSVSSVAMFNGSYY146 pKa = 9.99RR147 pKa = 11.84PEE149 pKa = 4.28DD150 pKa = 3.47VWILLLTSSTCYY162 pKa = 10.05GYY164 pKa = 10.96HH165 pKa = 6.77DD166 pKa = 3.93VVVDD170 pKa = 4.21IEE172 pKa = 4.37QCTLPSNIDD181 pKa = 3.29GCVCCSGVCYY191 pKa = 10.57FNDD194 pKa = 3.17NHH196 pKa = 6.23CFCGRR201 pKa = 11.84RR202 pKa = 11.84DD203 pKa = 3.85SNPFNPPCFQFIKK216 pKa = 10.55DD217 pKa = 3.83CNEE220 pKa = 3.88LYY222 pKa = 9.07GTNEE226 pKa = 4.07TKK228 pKa = 10.59QFICDD233 pKa = 3.88LVGDD237 pKa = 4.77DD238 pKa = 5.62NLDD241 pKa = 3.66SVNTLTKK248 pKa = 9.77EE249 pKa = 3.74GWRR252 pKa = 11.84RR253 pKa = 11.84FCDD256 pKa = 3.56VLWNTTYY263 pKa = 11.61GDD265 pKa = 3.61VEE267 pKa = 4.45SRR269 pKa = 11.84TFARR273 pKa = 11.84FLWFVFYY280 pKa = 10.94HH281 pKa = 6.88DD282 pKa = 3.8
Molecular weight: 31.97 kDa
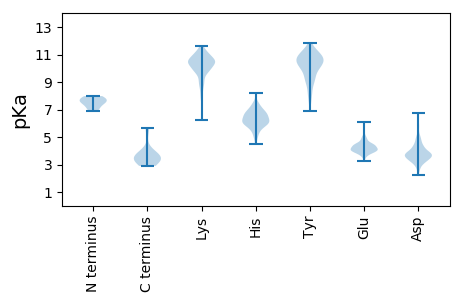
Isoelectric point according different methods:
Protein with the highest isoelectric point:
>sp|Q65676|TGB3_BNYVS Movement protein TGB3 OS=Beet necrotic yellow vein virus (isolate Japan/S) OX=652670 PE=3 SV=1
MM1 pKa = 7.3SRR3 pKa = 11.84EE4 pKa = 3.35ITARR8 pKa = 11.84PNKK11 pKa = 9.69NVPIVVGVCVVAFFVLLAFMQQKK34 pKa = 10.37HH35 pKa = 5.0KK36 pKa = 8.76THH38 pKa = 6.44SGGDD42 pKa = 3.43YY43 pKa = 10.74GVPTFSNGGKK53 pKa = 9.9YY54 pKa = 9.73RR55 pKa = 11.84DD56 pKa = 3.9GTRR59 pKa = 11.84SADD62 pKa = 3.47FNSNNHH68 pKa = 5.99RR69 pKa = 11.84AYY71 pKa = 10.45GCGGSGGSVSSRR83 pKa = 11.84VGQQLVVLAIVSVLIVSLLQRR104 pKa = 11.84LRR106 pKa = 11.84SPPEE110 pKa = 4.12HH111 pKa = 6.74ICNGACGG118 pKa = 3.35
MM1 pKa = 7.3SRR3 pKa = 11.84EE4 pKa = 3.35ITARR8 pKa = 11.84PNKK11 pKa = 9.69NVPIVVGVCVVAFFVLLAFMQQKK34 pKa = 10.37HH35 pKa = 5.0KK36 pKa = 8.76THH38 pKa = 6.44SGGDD42 pKa = 3.43YY43 pKa = 10.74GVPTFSNGGKK53 pKa = 9.9YY54 pKa = 9.73RR55 pKa = 11.84DD56 pKa = 3.9GTRR59 pKa = 11.84SADD62 pKa = 3.47FNSNNHH68 pKa = 5.99RR69 pKa = 11.84AYY71 pKa = 10.45GCGGSGGSVSSRR83 pKa = 11.84VGQQLVVLAIVSVLIVSLLQRR104 pKa = 11.84LRR106 pKa = 11.84SPPEE110 pKa = 4.12HH111 pKa = 6.74ICNGACGG118 pKa = 3.35
Molecular weight: 12.52 kDa
Isoelectric point according different methods:
Peptides (in silico digests for buttom-up proteomics)
Below you can find in silico digests of the whole proteome with Trypsin, Chymotrypsin, Trypsin+LysC, LysN, ArgC proteases suitable for different mass spec machines.| Try ESI |
 |
|---|
| ChTry ESI |
 |
|---|
| ArgC ESI |
 |
|---|
| LysN ESI |
 |
|---|
| TryLysC ESI |
 |
|---|
| Try MALDI |
 |
|---|
| ChTry MALDI |
 |
|---|
| ArgC MALDI |
 |
|---|
| LysN MALDI |
 |
|---|
| TryLysC MALDI |
 |
|---|
| Try LTQ |
 |
|---|
| ChTry LTQ |
 |
|---|
| ArgC LTQ |
 |
|---|
| LysN LTQ |
 |
|---|
| TryLysC LTQ |
 |
|---|
| Try MSlow |
 |
|---|
| ChTry MSlow |
 |
|---|
| ArgC MSlow |
 |
|---|
| LysN MSlow |
 |
|---|
| TryLysC MSlow |
 |
|---|
| Try MShigh |
 |
|---|
| ChTry MShigh |
 |
|---|
| ArgC MShigh |
 |
|---|
| LysN MShigh |
 |
|---|
| TryLysC MShigh |
 |
|---|
General Statistics
Number of major isoforms |
Number of additional isoforms |
Number of all proteins |
Number of amino acids |
Min. Seq. Length |
Max. Seq. Length |
Avg. Seq. Length |
Avg. Mol. Weight |
|---|---|---|---|---|---|---|---|
4479 |
118 |
2109 |
447.9 |
49.94 |
Amino acid frequency
Ala |
Cys |
Asp |
Glu |
Phe |
Gly |
His |
Ile |
Lys |
Leu |
|---|---|---|---|---|---|---|---|---|---|
6.988 ± 1.093 | 2.3 ± 0.757 |
6.586 ± 0.567 | 5.046 ± 0.624 |
4.555 ± 0.522 | 6.698 ± 0.774 |
2.367 ± 0.291 | 4.197 ± 0.32 |
5.09 ± 0.862 | 9.243 ± 0.486 |
Met |
Asn |
Gln |
Pro |
Arg |
Ser |
Thr |
Val |
Trp |
Tyr |
|---|---|---|---|---|---|---|---|---|---|
2.88 ± 0.249 | 4.867 ± 0.385 |
3.862 ± 0.245 | 2.612 ± 0.288 |
5.604 ± 0.423 | 8.127 ± 0.56 |
5.023 ± 0.624 | 9.221 ± 0.66 |
1.496 ± 0.158 | 3.215 ± 0.293 |
Most of the basic statistics you can see at this page can be downloaded from this CSV file
Proteome-pI is available under Creative Commons Attribution-NoDerivs license, for more details see here
| Reference: Kozlowski LP. Proteome-pI 2.0: Proteome Isoelectric Point Database Update. Nucleic Acids Res. 2021, doi: 10.1093/nar/gkab944 | Contact: Lukasz P. Kozlowski |
