Vibrio atlanticus (strain LGP32) (Vibrio splendidus (strain Mel32))
Taxonomy: cellular organisms; Bacteria; Proteobacteria; Gammaproteobacteria; Vibrionales; Vibrionaceae; Vibrio; Vibrio atlanticus
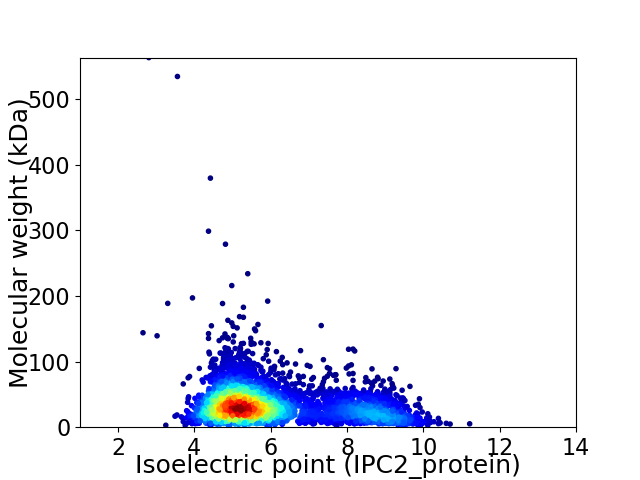
Average proteome isoelectric point is 6.02
Get precalculated fractions of proteins

Virtual 2D-PAGE plot for 4420 proteins (isoelectric point calculated using IPC2_protein)
Get csv file with sequences according to given criteria:
* You can choose from 21 different methods for calculating isoelectric point
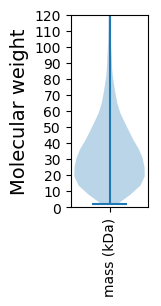
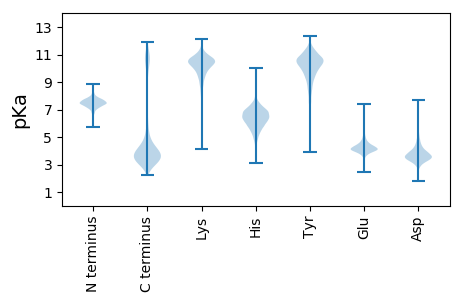
Summary statistics related to proteome-wise predictions


Protein with the lowest isoelectric point:
>tr|B7VKF1|B7VKF1_VIBA3 Peptidoglycan glycosyltransferase MrdB OS=Vibrio atlanticus (strain LGP32) OX=575788 GN=mrdB PE=3 SV=1
MM1 pKa = 7.7KK2 pKa = 10.13YY3 pKa = 10.75SPILAVALSALFIVGCNDD21 pKa = 3.27DD22 pKa = 4.83DD23 pKa = 4.76QPTTQLQAVHH33 pKa = 7.15ASPDD37 pKa = 3.37APLANVLVNSQARR50 pKa = 11.84WTGVDD55 pKa = 3.35YY56 pKa = 11.18AQASGYY62 pKa = 9.38TSVNQGQTTLQVDD75 pKa = 3.78VQLPGDD81 pKa = 4.04GVATVIPPSQFDD93 pKa = 3.57LSGDD97 pKa = 3.33LDD99 pKa = 3.96YY100 pKa = 11.53TVMVVGDD107 pKa = 4.24ADD109 pKa = 3.74GSNNPVEE116 pKa = 4.38ALVVTRR122 pKa = 11.84PAAGTATSSSLDD134 pKa = 3.51VQVVHH139 pKa = 7.02AATGVGDD146 pKa = 3.6VNLYY150 pKa = 8.08VTAPNDD156 pKa = 3.66PLGAPIGTLGYY167 pKa = 10.67KK168 pKa = 10.61GFTDD172 pKa = 3.8VLNIPAGQYY181 pKa = 9.21RR182 pKa = 11.84VRR184 pKa = 11.84LEE186 pKa = 4.29TVSGSAIAFDD196 pKa = 3.86SGEE199 pKa = 3.91ITLPAGSEE207 pKa = 3.96LTIAAVPRR215 pKa = 11.84ADD217 pKa = 3.58SSSTSPVKK225 pKa = 10.77LMVMDD230 pKa = 5.36GKK232 pKa = 10.73SSSIIYY238 pKa = 10.65DD239 pKa = 3.31MAEE242 pKa = 3.9SAEE245 pKa = 3.99VRR247 pKa = 11.84VGHH250 pKa = 6.64LVDD253 pKa = 4.71GAPSVDD259 pKa = 3.6VYY261 pKa = 11.85VNSAKK266 pKa = 10.23FAPLDD271 pKa = 3.28ALMFKK276 pKa = 9.58EE277 pKa = 4.22VRR279 pKa = 11.84GFLDD283 pKa = 4.14LAAGSYY289 pKa = 10.78DD290 pKa = 2.95IDD292 pKa = 3.57IYY294 pKa = 10.4EE295 pKa = 4.43TATTSPTFIDD305 pKa = 3.39VDD307 pKa = 3.85GLAVFAGMDD316 pKa = 3.37YY317 pKa = 10.84SIYY320 pKa = 10.93AVGTVSPLNLEE331 pKa = 4.1ALVVPEE337 pKa = 4.13NRR339 pKa = 11.84RR340 pKa = 11.84SVATSAVLNITHH352 pKa = 7.49AAANPIAASVDD363 pKa = 2.94IYY365 pKa = 10.54LTEE368 pKa = 4.0NVGISGSTPALSNVKK383 pKa = 10.29FKK385 pKa = 11.38DD386 pKa = 3.65FANGIYY392 pKa = 9.76VAAGTYY398 pKa = 9.95YY399 pKa = 9.56VTITVAGDD407 pKa = 3.48PSTVAIDD414 pKa = 3.61SAPATLVNGVVYY426 pKa = 9.48QVVAIDD432 pKa = 4.17DD433 pKa = 3.93SMGTGFNLIVSEE445 pKa = 4.34TTDD448 pKa = 2.85
MM1 pKa = 7.7KK2 pKa = 10.13YY3 pKa = 10.75SPILAVALSALFIVGCNDD21 pKa = 3.27DD22 pKa = 4.83DD23 pKa = 4.76QPTTQLQAVHH33 pKa = 7.15ASPDD37 pKa = 3.37APLANVLVNSQARR50 pKa = 11.84WTGVDD55 pKa = 3.35YY56 pKa = 11.18AQASGYY62 pKa = 9.38TSVNQGQTTLQVDD75 pKa = 3.78VQLPGDD81 pKa = 4.04GVATVIPPSQFDD93 pKa = 3.57LSGDD97 pKa = 3.33LDD99 pKa = 3.96YY100 pKa = 11.53TVMVVGDD107 pKa = 4.24ADD109 pKa = 3.74GSNNPVEE116 pKa = 4.38ALVVTRR122 pKa = 11.84PAAGTATSSSLDD134 pKa = 3.51VQVVHH139 pKa = 7.02AATGVGDD146 pKa = 3.6VNLYY150 pKa = 8.08VTAPNDD156 pKa = 3.66PLGAPIGTLGYY167 pKa = 10.67KK168 pKa = 10.61GFTDD172 pKa = 3.8VLNIPAGQYY181 pKa = 9.21RR182 pKa = 11.84VRR184 pKa = 11.84LEE186 pKa = 4.29TVSGSAIAFDD196 pKa = 3.86SGEE199 pKa = 3.91ITLPAGSEE207 pKa = 3.96LTIAAVPRR215 pKa = 11.84ADD217 pKa = 3.58SSSTSPVKK225 pKa = 10.77LMVMDD230 pKa = 5.36GKK232 pKa = 10.73SSSIIYY238 pKa = 10.65DD239 pKa = 3.31MAEE242 pKa = 3.9SAEE245 pKa = 3.99VRR247 pKa = 11.84VGHH250 pKa = 6.64LVDD253 pKa = 4.71GAPSVDD259 pKa = 3.6VYY261 pKa = 11.85VNSAKK266 pKa = 10.23FAPLDD271 pKa = 3.28ALMFKK276 pKa = 9.58EE277 pKa = 4.22VRR279 pKa = 11.84GFLDD283 pKa = 4.14LAAGSYY289 pKa = 10.78DD290 pKa = 2.95IDD292 pKa = 3.57IYY294 pKa = 10.4EE295 pKa = 4.43TATTSPTFIDD305 pKa = 3.39VDD307 pKa = 3.85GLAVFAGMDD316 pKa = 3.37YY317 pKa = 10.84SIYY320 pKa = 10.93AVGTVSPLNLEE331 pKa = 4.1ALVVPEE337 pKa = 4.13NRR339 pKa = 11.84RR340 pKa = 11.84SVATSAVLNITHH352 pKa = 7.49AAANPIAASVDD363 pKa = 2.94IYY365 pKa = 10.54LTEE368 pKa = 4.0NVGISGSTPALSNVKK383 pKa = 10.29FKK385 pKa = 11.38DD386 pKa = 3.65FANGIYY392 pKa = 9.76VAAGTYY398 pKa = 9.95YY399 pKa = 9.56VTITVAGDD407 pKa = 3.48PSTVAIDD414 pKa = 3.61SAPATLVNGVVYY426 pKa = 9.48QVVAIDD432 pKa = 4.17DD433 pKa = 3.93SMGTGFNLIVSEE445 pKa = 4.34TTDD448 pKa = 2.85
Molecular weight: 46.25 kDa
Isoelectric point according different methods:
Protein with the highest isoelectric point:
>tr|B7VGL3|B7VGL3_VIBA3 3-ketoacyl-CoA thiolase OS=Vibrio atlanticus (strain LGP32) OX=575788 GN=fadA PE=3 SV=1
MM1 pKa = 7.45KK2 pKa = 9.5RR3 pKa = 11.84TFQPTVLKK11 pKa = 10.46RR12 pKa = 11.84KK13 pKa = 7.65RR14 pKa = 11.84THH16 pKa = 5.89GFRR19 pKa = 11.84ARR21 pKa = 11.84MATKK25 pKa = 10.44NGRR28 pKa = 11.84ATINARR34 pKa = 11.84RR35 pKa = 11.84AKK37 pKa = 9.74GRR39 pKa = 11.84KK40 pKa = 8.91RR41 pKa = 11.84LSKK44 pKa = 10.84
MM1 pKa = 7.45KK2 pKa = 9.5RR3 pKa = 11.84TFQPTVLKK11 pKa = 10.46RR12 pKa = 11.84KK13 pKa = 7.65RR14 pKa = 11.84THH16 pKa = 5.89GFRR19 pKa = 11.84ARR21 pKa = 11.84MATKK25 pKa = 10.44NGRR28 pKa = 11.84ATINARR34 pKa = 11.84RR35 pKa = 11.84AKK37 pKa = 9.74GRR39 pKa = 11.84KK40 pKa = 8.91RR41 pKa = 11.84LSKK44 pKa = 10.84
Molecular weight: 5.18 kDa
Isoelectric point according different methods:
Peptides (in silico digests for buttom-up proteomics)
Below you can find in silico digests of the whole proteome with Trypsin, Chymotrypsin, Trypsin+LysC, LysN, ArgC proteases suitable for different mass spec machines.| Try ESI |
 |
|---|
| ChTry ESI |
 |
|---|
| ArgC ESI |
 |
|---|
| LysN ESI |
 |
|---|
| TryLysC ESI |
 |
|---|
| Try MALDI |
 |
|---|
| ChTry MALDI |
 |
|---|
| ArgC MALDI |
 |
|---|
| LysN MALDI |
 |
|---|
| TryLysC MALDI |
 |
|---|
| Try LTQ |
 |
|---|
| ChTry LTQ |
 |
|---|
| ArgC LTQ |
 |
|---|
| LysN LTQ |
 |
|---|
| TryLysC LTQ |
 |
|---|
| Try MSlow |
 |
|---|
| ChTry MSlow |
 |
|---|
| ArgC MSlow |
 |
|---|
| LysN MSlow |
 |
|---|
| TryLysC MSlow |
 |
|---|
| Try MShigh |
 |
|---|
| ChTry MShigh |
 |
|---|
| ArgC MShigh |
 |
|---|
| LysN MShigh |
 |
|---|
| TryLysC MShigh |
 |
|---|
General Statistics
Number of major isoforms |
Number of additional isoforms |
Number of all proteins |
Number of amino acids |
Min. Seq. Length |
Max. Seq. Length |
Avg. Seq. Length |
Avg. Mol. Weight |
|---|---|---|---|---|---|---|---|
0 |
1422917 |
21 |
5372 |
321.9 |
35.76 |
Amino acid frequency
Ala |
Cys |
Asp |
Glu |
Phe |
Gly |
His |
Ile |
Lys |
Leu |
|---|---|---|---|---|---|---|---|---|---|
8.296 ± 0.044 | 0.997 ± 0.013 |
5.604 ± 0.041 | 6.506 ± 0.036 |
4.192 ± 0.026 | 6.739 ± 0.038 |
2.178 ± 0.021 | 6.373 ± 0.029 |
5.423 ± 0.036 | 10.225 ± 0.043 |
Met |
Asn |
Gln |
Pro |
Arg |
Ser |
Thr |
Val |
Trp |
Tyr |
|---|---|---|---|---|---|---|---|---|---|
2.701 ± 0.02 | 4.342 ± 0.027 |
3.801 ± 0.021 | 4.474 ± 0.032 |
4.25 ± 0.03 | 7.026 ± 0.035 |
5.502 ± 0.037 | 7.136 ± 0.034 |
1.224 ± 0.015 | 3.01 ± 0.024 |
Most of the basic statistics you can see at this page can be downloaded from this CSV file
Proteome-pI is available under Creative Commons Attribution-NoDerivs license, for more details see here
| Reference: Kozlowski LP. Proteome-pI 2.0: Proteome Isoelectric Point Database Update. Nucleic Acids Res. 2021, doi: 10.1093/nar/gkab944 | Contact: Lukasz P. Kozlowski |
