Tenacibaculum sp. KUL118
Taxonomy: cellular organisms; Bacteria; FCB group; Bacteroidetes/Chlorobi group; Bacteroidetes; Flavobacteriia; Flavobacteriales; Flavobacteriaceae; Tenacibaculum; unclassified Tenacibaculum
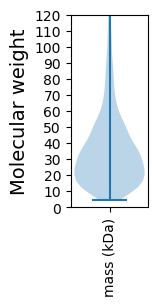
Average proteome isoelectric point is 6.35
Get precalculated fractions of proteins

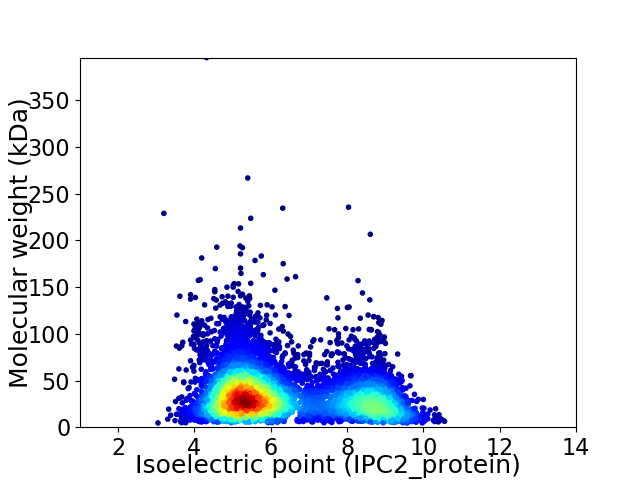
Virtual 2D-PAGE plot for 6803 proteins (isoelectric point calculated using IPC2_protein)
Get csv file with sequences according to given criteria:
* You can choose from 21 different methods for calculating isoelectric point
Summary statistics related to proteome-wise predictions


Protein with the lowest isoelectric point:
>tr|A0A640Q3I3|A0A640Q3I3_9FLAO Membrane protein OS=Tenacibaculum sp. KUL118 OX=2480802 GN=KUL118_41580 PE=3 SV=1
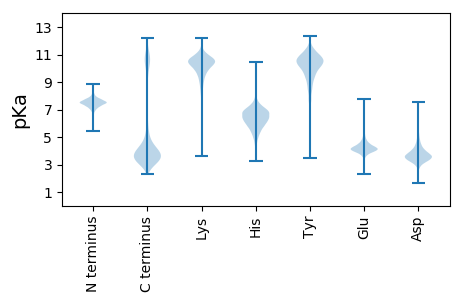
MM1 pKa = 7.74SDD3 pKa = 3.06SALSIGLFYY12 pKa = 11.16GSTTCYY18 pKa = 10.67TEE20 pKa = 3.71MAAEE24 pKa = 5.15KK25 pKa = 10.23IQAQLNSLFDD35 pKa = 3.95EE36 pKa = 5.26NIVEE40 pKa = 3.9LHH42 pKa = 6.22NIKK45 pKa = 10.46DD46 pKa = 3.71VSLSRR51 pKa = 11.84TADD54 pKa = 3.15YY55 pKa = 11.03DD56 pKa = 3.69IIIFGISTWDD66 pKa = 3.43FGEE69 pKa = 4.3LQEE72 pKa = 5.04DD73 pKa = 4.5WEE75 pKa = 4.76SHH77 pKa = 4.89WEE79 pKa = 4.11DD80 pKa = 3.59VHH82 pKa = 9.11SLDD85 pKa = 5.8LSGKK89 pKa = 7.97TIALFGLGDD98 pKa = 3.5QLGYY102 pKa = 11.04GEE104 pKa = 4.72WFQDD108 pKa = 3.69ALGMLHH114 pKa = 7.44DD115 pKa = 6.17AILPSGCNVVGYY127 pKa = 8.9WPNEE131 pKa = 3.99GYY133 pKa = 10.9EE134 pKa = 4.26FTASKK139 pKa = 11.01ALTEE143 pKa = 4.52DD144 pKa = 3.38RR145 pKa = 11.84SQFVGLSLDD154 pKa = 5.49DD155 pKa = 3.93EE156 pKa = 4.39NQYY159 pKa = 11.8DD160 pKa = 3.7KK161 pKa = 11.34TDD163 pKa = 3.17ARR165 pKa = 11.84IEE167 pKa = 4.07AWCEE171 pKa = 3.52QLLVSLAA178 pKa = 3.54
MM1 pKa = 7.74SDD3 pKa = 3.06SALSIGLFYY12 pKa = 11.16GSTTCYY18 pKa = 10.67TEE20 pKa = 3.71MAAEE24 pKa = 5.15KK25 pKa = 10.23IQAQLNSLFDD35 pKa = 3.95EE36 pKa = 5.26NIVEE40 pKa = 3.9LHH42 pKa = 6.22NIKK45 pKa = 10.46DD46 pKa = 3.71VSLSRR51 pKa = 11.84TADD54 pKa = 3.15YY55 pKa = 11.03DD56 pKa = 3.69IIIFGISTWDD66 pKa = 3.43FGEE69 pKa = 4.3LQEE72 pKa = 5.04DD73 pKa = 4.5WEE75 pKa = 4.76SHH77 pKa = 4.89WEE79 pKa = 4.11DD80 pKa = 3.59VHH82 pKa = 9.11SLDD85 pKa = 5.8LSGKK89 pKa = 7.97TIALFGLGDD98 pKa = 3.5QLGYY102 pKa = 11.04GEE104 pKa = 4.72WFQDD108 pKa = 3.69ALGMLHH114 pKa = 7.44DD115 pKa = 6.17AILPSGCNVVGYY127 pKa = 8.9WPNEE131 pKa = 3.99GYY133 pKa = 10.9EE134 pKa = 4.26FTASKK139 pKa = 11.01ALTEE143 pKa = 4.52DD144 pKa = 3.38RR145 pKa = 11.84SQFVGLSLDD154 pKa = 5.49DD155 pKa = 3.93EE156 pKa = 4.39NQYY159 pKa = 11.8DD160 pKa = 3.7KK161 pKa = 11.34TDD163 pKa = 3.17ARR165 pKa = 11.84IEE167 pKa = 4.07AWCEE171 pKa = 3.52QLLVSLAA178 pKa = 3.54
Molecular weight: 19.95 kDa
Isoelectric point according different methods:
Protein with the highest isoelectric point:
>tr|A0A640PYJ0|A0A640PYJ0_9FLAO TonB-dependent receptor OS=Tenacibaculum sp. KUL118 OX=2480802 GN=KUL118_24030 PE=3 SV=1
MM1 pKa = 7.73EE2 pKa = 5.53YY3 pKa = 10.13IFGFIIQIAGIMLLAKK19 pKa = 10.31LSWSLLRR26 pKa = 11.84LLARR30 pKa = 11.84QSVRR34 pKa = 11.84PFRR37 pKa = 11.84FVFTQIKK44 pKa = 10.23RR45 pKa = 11.84LFTPTPKK52 pKa = 9.72RR53 pKa = 11.84RR54 pKa = 11.84PMAVPKK60 pKa = 10.52APGMPRR66 pKa = 11.84LTSAFYY72 pKa = 10.61KK73 pKa = 10.48EE74 pKa = 3.67PHH76 pKa = 6.1QYY78 pKa = 11.64DD79 pKa = 3.46MALLEE84 pKa = 4.31IPTYY88 pKa = 10.64LRR90 pKa = 11.84RR91 pKa = 11.84QSSLPSRR98 pKa = 11.84VEE100 pKa = 3.68ATVCTEE106 pKa = 3.94FNN108 pKa = 3.45
MM1 pKa = 7.73EE2 pKa = 5.53YY3 pKa = 10.13IFGFIIQIAGIMLLAKK19 pKa = 10.31LSWSLLRR26 pKa = 11.84LLARR30 pKa = 11.84QSVRR34 pKa = 11.84PFRR37 pKa = 11.84FVFTQIKK44 pKa = 10.23RR45 pKa = 11.84LFTPTPKK52 pKa = 9.72RR53 pKa = 11.84RR54 pKa = 11.84PMAVPKK60 pKa = 10.52APGMPRR66 pKa = 11.84LTSAFYY72 pKa = 10.61KK73 pKa = 10.48EE74 pKa = 3.67PHH76 pKa = 6.1QYY78 pKa = 11.64DD79 pKa = 3.46MALLEE84 pKa = 4.31IPTYY88 pKa = 10.64LRR90 pKa = 11.84RR91 pKa = 11.84QSSLPSRR98 pKa = 11.84VEE100 pKa = 3.68ATVCTEE106 pKa = 3.94FNN108 pKa = 3.45
Molecular weight: 12.59 kDa
Isoelectric point according different methods:
Peptides (in silico digests for buttom-up proteomics)
Below you can find in silico digests of the whole proteome with Trypsin, Chymotrypsin, Trypsin+LysC, LysN, ArgC proteases suitable for different mass spec machines.| Try ESI |
 |
|---|
| ChTry ESI |
 |
|---|
| ArgC ESI |
 |
|---|
| LysN ESI |
 |
|---|
| TryLysC ESI |
 |
|---|
| Try MALDI |
 |
|---|
| ChTry MALDI |
 |
|---|
| ArgC MALDI |
 |
|---|
| LysN MALDI |
 |
|---|
| TryLysC MALDI |
 |
|---|
| Try LTQ |
 |
|---|
| ChTry LTQ |
 |
|---|
| ArgC LTQ |
 |
|---|
| LysN LTQ |
 |
|---|
| TryLysC LTQ |
 |
|---|
| Try MSlow |
 |
|---|
| ChTry MSlow |
 |
|---|
| ArgC MSlow |
 |
|---|
| LysN MSlow |
 |
|---|
| TryLysC MSlow |
 |
|---|
| Try MShigh |
 |
|---|
| ChTry MShigh |
 |
|---|
| ArgC MShigh |
 |
|---|
| LysN MShigh |
 |
|---|
| TryLysC MShigh |
 |
|---|
General Statistics
Number of major isoforms |
Number of additional isoforms |
Number of all proteins |
Number of amino acids |
Min. Seq. Length |
Max. Seq. Length |
Avg. Seq. Length |
Avg. Mol. Weight |
|---|---|---|---|---|---|---|---|
0 |
2271612 |
40 |
3581 |
333.9 |
37.36 |
Amino acid frequency
Ala |
Cys |
Asp |
Glu |
Phe |
Gly |
His |
Ile |
Lys |
Leu |
|---|---|---|---|---|---|---|---|---|---|
7.654 ± 0.036 | 0.831 ± 0.009 |
5.593 ± 0.021 | 6.669 ± 0.027 |
4.646 ± 0.022 | 6.487 ± 0.028 |
1.999 ± 0.015 | 6.905 ± 0.026 |
6.819 ± 0.042 | 9.536 ± 0.032 |
Met |
Asn |
Gln |
Pro |
Arg |
Ser |
Thr |
Val |
Trp |
Tyr |
|---|---|---|---|---|---|---|---|---|---|
2.289 ± 0.014 | 5.395 ± 0.029 |
3.588 ± 0.016 | 3.777 ± 0.021 |
3.997 ± 0.023 | 6.666 ± 0.026 |
5.756 ± 0.025 | 6.752 ± 0.024 |
1.112 ± 0.01 | 3.527 ± 0.02 |
Most of the basic statistics you can see at this page can be downloaded from this CSV file
Proteome-pI is available under Creative Commons Attribution-NoDerivs license, for more details see here
| Reference: Kozlowski LP. Proteome-pI 2.0: Proteome Isoelectric Point Database Update. Nucleic Acids Res. 2021, doi: 10.1093/nar/gkab944 | Contact: Lukasz P. Kozlowski |
