Desulfosporosinus sp. OL
Taxonomy: cellular organisms; Bacteria; Terrabacteria group; Firmicutes; Clostridia; Eubacteriales; Peptococcaceae; Desulfosporosinus
Average proteome isoelectric point is 6.5
Get precalculated fractions of proteins

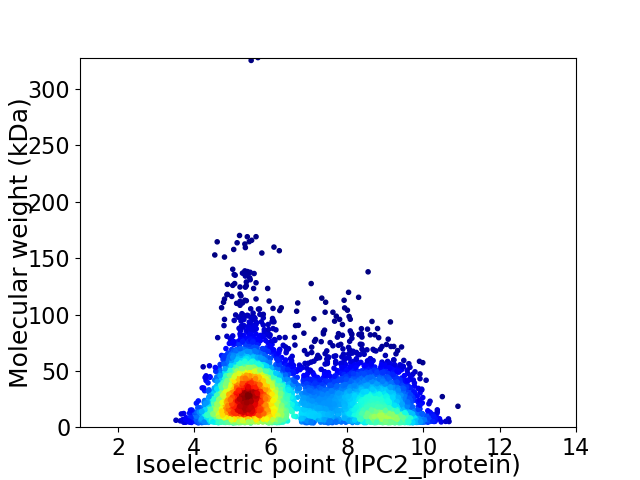
Virtual 2D-PAGE plot for 5425 proteins (isoelectric point calculated using IPC2_protein)
Get csv file with sequences according to given criteria:
* You can choose from 21 different methods for calculating isoelectric point
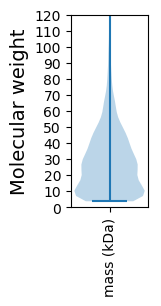
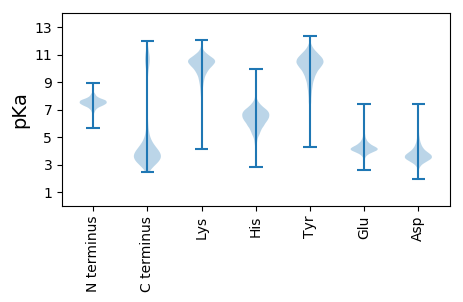
Summary statistics related to proteome-wise predictions


Protein with the lowest isoelectric point:
>tr|A0A1Q8QVW0|A0A1Q8QVW0_9FIRM Nucleotide-binding protein OS=Desulfosporosinus sp. OL OX=1888891 GN=DSOL_2611 PE=4 SV=1
MM1 pKa = 8.44DD2 pKa = 3.86YY3 pKa = 9.99PYY5 pKa = 10.81LIGYY9 pKa = 7.99VYY11 pKa = 10.54SEE13 pKa = 4.48EE14 pKa = 4.14GRR16 pKa = 11.84SEE18 pKa = 4.67HH19 pKa = 6.3FLKK22 pKa = 8.3TTPTNIASFIIKK34 pKa = 10.21NSPLDD39 pKa = 3.78VIQITTPLDD48 pKa = 3.26TAFISTRR55 pKa = 11.84AGFIDD60 pKa = 3.8YY61 pKa = 10.83CADD64 pKa = 3.4QEE66 pKa = 4.28FLRR69 pKa = 11.84NEE71 pKa = 4.32LLPVLIPMQMGDD83 pKa = 3.74TEE85 pKa = 4.22PSEE88 pKa = 4.35VEE90 pKa = 3.81LVPEE94 pKa = 4.03NEE96 pKa = 4.21MNSMDD101 pKa = 4.65EE102 pKa = 4.3EE103 pKa = 4.96GLDD106 pKa = 3.52SLEE109 pKa = 4.13FF110 pKa = 4.75
MM1 pKa = 8.44DD2 pKa = 3.86YY3 pKa = 9.99PYY5 pKa = 10.81LIGYY9 pKa = 7.99VYY11 pKa = 10.54SEE13 pKa = 4.48EE14 pKa = 4.14GRR16 pKa = 11.84SEE18 pKa = 4.67HH19 pKa = 6.3FLKK22 pKa = 8.3TTPTNIASFIIKK34 pKa = 10.21NSPLDD39 pKa = 3.78VIQITTPLDD48 pKa = 3.26TAFISTRR55 pKa = 11.84AGFIDD60 pKa = 3.8YY61 pKa = 10.83CADD64 pKa = 3.4QEE66 pKa = 4.28FLRR69 pKa = 11.84NEE71 pKa = 4.32LLPVLIPMQMGDD83 pKa = 3.74TEE85 pKa = 4.22PSEE88 pKa = 4.35VEE90 pKa = 3.81LVPEE94 pKa = 4.03NEE96 pKa = 4.21MNSMDD101 pKa = 4.65EE102 pKa = 4.3EE103 pKa = 4.96GLDD106 pKa = 3.52SLEE109 pKa = 4.13FF110 pKa = 4.75
Molecular weight: 12.5 kDa
Isoelectric point according different methods:
Protein with the highest isoelectric point:
>tr|A0A1Q8QM20|A0A1Q8QM20_9FIRM MacB_PCD domain-containing protein OS=Desulfosporosinus sp. OL OX=1888891 GN=DSOL_4043 PE=4 SV=1
MM1 pKa = 7.19RR2 pKa = 11.84QRR4 pKa = 11.84VRR6 pKa = 11.84MGIMGTAKK14 pKa = 10.29GPHH17 pKa = 5.49IQALATALQNRR28 pKa = 11.84GAEE31 pKa = 4.14VSFVSPQRR39 pKa = 11.84LTSFIPEE46 pKa = 4.08PATIITGAGGSRR58 pKa = 11.84EE59 pKa = 3.96NLRR62 pKa = 11.84DD63 pKa = 3.48LDD65 pKa = 4.05ALLVRR70 pKa = 11.84SLPGGSLEE78 pKa = 4.01QVIYY82 pKa = 10.48RR83 pKa = 11.84VDD85 pKa = 3.25VLHH88 pKa = 6.95RR89 pKa = 11.84LEE91 pKa = 4.36KK92 pKa = 10.88LGLKK96 pKa = 9.62VINRR100 pKa = 11.84AAVLEE105 pKa = 4.3KK106 pKa = 10.71NSRR109 pKa = 11.84QVLYY113 pKa = 9.27VCFVGRR119 pKa = 11.84CGLASTQNGRR129 pKa = 11.84DD130 pKa = 3.16RR131 pKa = 11.84KK132 pKa = 10.18LRR134 pKa = 11.84SGDD137 pKa = 3.64GSCEE141 pKa = 3.72EE142 pKa = 5.11DD143 pKa = 3.4GGSGCEE149 pKa = 3.77TSFWLPRR156 pKa = 11.84NRR158 pKa = 11.84HH159 pKa = 4.13GLGRR163 pKa = 11.84GSRR166 pKa = 11.84GGLPRR171 pKa = 11.84FPSPGIGPVCVLFTRR186 pKa = 11.84ISTAA190 pKa = 2.91
MM1 pKa = 7.19RR2 pKa = 11.84QRR4 pKa = 11.84VRR6 pKa = 11.84MGIMGTAKK14 pKa = 10.29GPHH17 pKa = 5.49IQALATALQNRR28 pKa = 11.84GAEE31 pKa = 4.14VSFVSPQRR39 pKa = 11.84LTSFIPEE46 pKa = 4.08PATIITGAGGSRR58 pKa = 11.84EE59 pKa = 3.96NLRR62 pKa = 11.84DD63 pKa = 3.48LDD65 pKa = 4.05ALLVRR70 pKa = 11.84SLPGGSLEE78 pKa = 4.01QVIYY82 pKa = 10.48RR83 pKa = 11.84VDD85 pKa = 3.25VLHH88 pKa = 6.95RR89 pKa = 11.84LEE91 pKa = 4.36KK92 pKa = 10.88LGLKK96 pKa = 9.62VINRR100 pKa = 11.84AAVLEE105 pKa = 4.3KK106 pKa = 10.71NSRR109 pKa = 11.84QVLYY113 pKa = 9.27VCFVGRR119 pKa = 11.84CGLASTQNGRR129 pKa = 11.84DD130 pKa = 3.16RR131 pKa = 11.84KK132 pKa = 10.18LRR134 pKa = 11.84SGDD137 pKa = 3.64GSCEE141 pKa = 3.72EE142 pKa = 5.11DD143 pKa = 3.4GGSGCEE149 pKa = 3.77TSFWLPRR156 pKa = 11.84NRR158 pKa = 11.84HH159 pKa = 4.13GLGRR163 pKa = 11.84GSRR166 pKa = 11.84GGLPRR171 pKa = 11.84FPSPGIGPVCVLFTRR186 pKa = 11.84ISTAA190 pKa = 2.91
Molecular weight: 20.49 kDa
Isoelectric point according different methods:
Peptides (in silico digests for buttom-up proteomics)
Below you can find in silico digests of the whole proteome with Trypsin, Chymotrypsin, Trypsin+LysC, LysN, ArgC proteases suitable for different mass spec machines.| Try ESI |
 |
|---|
| ChTry ESI |
 |
|---|
| ArgC ESI |
 |
|---|
| LysN ESI |
 |
|---|
| TryLysC ESI |
 |
|---|
| Try MALDI |
 |
|---|
| ChTry MALDI |
 |
|---|
| ArgC MALDI |
 |
|---|
| LysN MALDI |
 |
|---|
| TryLysC MALDI |
 |
|---|
| Try LTQ |
 |
|---|
| ChTry LTQ |
 |
|---|
| ArgC LTQ |
 |
|---|
| LysN LTQ |
 |
|---|
| TryLysC LTQ |
 |
|---|
| Try MSlow |
 |
|---|
| ChTry MSlow |
 |
|---|
| ArgC MSlow |
 |
|---|
| LysN MSlow |
 |
|---|
| TryLysC MSlow |
 |
|---|
| Try MShigh |
 |
|---|
| ChTry MShigh |
 |
|---|
| ArgC MShigh |
 |
|---|
| LysN MShigh |
 |
|---|
| TryLysC MShigh |
 |
|---|
General Statistics
Number of major isoforms |
Number of additional isoforms |
Number of all proteins |
Number of amino acids |
Min. Seq. Length |
Max. Seq. Length |
Avg. Seq. Length |
Avg. Mol. Weight |
|---|---|---|---|---|---|---|---|
0 |
1464743 |
37 |
2863 |
270.0 |
30.06 |
Amino acid frequency
Ala |
Cys |
Asp |
Glu |
Phe |
Gly |
His |
Ile |
Lys |
Leu |
|---|---|---|---|---|---|---|---|---|---|
7.619 ± 0.037 | 1.12 ± 0.014 |
4.915 ± 0.029 | 6.904 ± 0.044 |
4.033 ± 0.029 | 7.473 ± 0.035 |
1.923 ± 0.017 | 7.151 ± 0.029 |
6.08 ± 0.032 | 10.419 ± 0.037 |
Met |
Asn |
Gln |
Pro |
Arg |
Ser |
Thr |
Val |
Trp |
Tyr |
|---|---|---|---|---|---|---|---|---|---|
2.719 ± 0.019 | 4.035 ± 0.023 |
3.951 ± 0.022 | 3.842 ± 0.025 |
4.838 ± 0.03 | 6.025 ± 0.027 |
5.402 ± 0.033 | 7.288 ± 0.034 |
1.086 ± 0.013 | 3.178 ± 0.024 |
Most of the basic statistics you can see at this page can be downloaded from this CSV file
Proteome-pI is available under Creative Commons Attribution-NoDerivs license, for more details see here
| Reference: Kozlowski LP. Proteome-pI 2.0: Proteome Isoelectric Point Database Update. Nucleic Acids Res. 2021, doi: 10.1093/nar/gkab944 | Contact: Lukasz P. Kozlowski |
