Caloramator quimbayensis
Taxonomy: cellular organisms; Bacteria; Terrabacteria group; Firmicutes; Clostridia; Eubacteriales; Clostridiaceae; Caloramator
Average proteome isoelectric point is 6.67
Get precalculated fractions of proteins
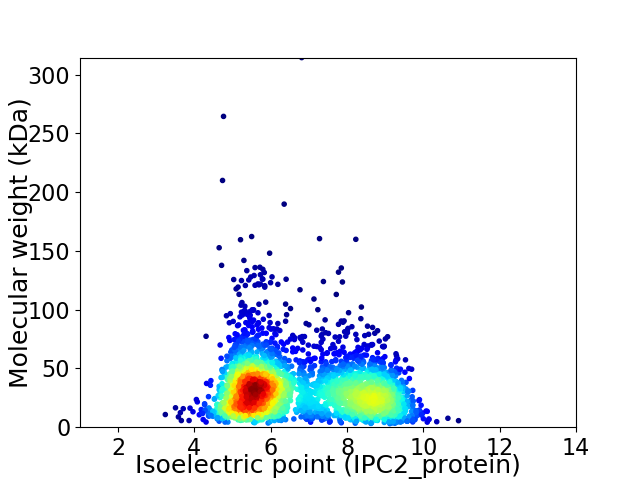
Virtual 2D-PAGE plot for 2996 proteins (isoelectric point calculated using IPC2_protein)
Get csv file with sequences according to given criteria:
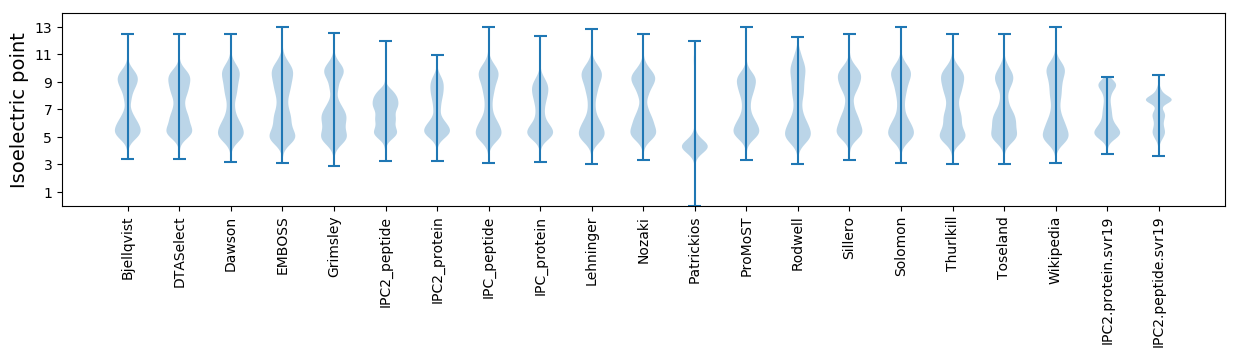
* You can choose from 21 different methods for calculating isoelectric point
Summary statistics related to proteome-wise predictions
Protein with the lowest isoelectric point:
>tr|A0A1T4XLY1|A0A1T4XLY1_9CLOT 3'-5' exoribonuclease OS=Caloramator quimbayensis OX=1147123 GN=SAMN05443428_11090 PE=4 SV=1
MM1 pKa = 7.62IKK3 pKa = 10.2HH4 pKa = 6.09KK5 pKa = 10.55EE6 pKa = 3.69ILNFLEE12 pKa = 4.42NEE14 pKa = 4.04GLEE17 pKa = 4.39EE18 pKa = 4.32IDD20 pKa = 3.68EE21 pKa = 4.21IEE23 pKa = 4.14YY24 pKa = 11.19NKK26 pKa = 10.88DD27 pKa = 2.5IFVYY31 pKa = 10.61NFFYY35 pKa = 10.62TFDD38 pKa = 3.59EE39 pKa = 4.71AEE41 pKa = 3.8IEE43 pKa = 4.17AAKK46 pKa = 10.39EE47 pKa = 3.8YY48 pKa = 11.33ANEE51 pKa = 4.06NCDD54 pKa = 3.69AEE56 pKa = 4.48STEE59 pKa = 4.86DD60 pKa = 3.06EE61 pKa = 4.46WNEE64 pKa = 3.94EE65 pKa = 4.01FYY67 pKa = 11.2LPYY70 pKa = 9.91LTDD73 pKa = 3.27IAADD77 pKa = 3.63NVRR80 pKa = 11.84DD81 pKa = 3.88IVDD84 pKa = 4.97DD85 pKa = 3.43ICEE88 pKa = 4.01EE89 pKa = 3.99FGLFGEE95 pKa = 5.08FVAYY99 pKa = 9.79EE100 pKa = 4.0MDD102 pKa = 3.28MGSSEE107 pKa = 4.13RR108 pKa = 11.84CEE110 pKa = 3.97FTVVFAKK117 pKa = 10.56EE118 pKa = 4.26GIEE121 pKa = 3.92FDD123 pKa = 3.34IDD125 pKa = 3.82EE126 pKa = 4.43IMEE129 pKa = 4.27KK130 pKa = 11.03LEE132 pKa = 3.99LL133 pKa = 4.55
MM1 pKa = 7.62IKK3 pKa = 10.2HH4 pKa = 6.09KK5 pKa = 10.55EE6 pKa = 3.69ILNFLEE12 pKa = 4.42NEE14 pKa = 4.04GLEE17 pKa = 4.39EE18 pKa = 4.32IDD20 pKa = 3.68EE21 pKa = 4.21IEE23 pKa = 4.14YY24 pKa = 11.19NKK26 pKa = 10.88DD27 pKa = 2.5IFVYY31 pKa = 10.61NFFYY35 pKa = 10.62TFDD38 pKa = 3.59EE39 pKa = 4.71AEE41 pKa = 3.8IEE43 pKa = 4.17AAKK46 pKa = 10.39EE47 pKa = 3.8YY48 pKa = 11.33ANEE51 pKa = 4.06NCDD54 pKa = 3.69AEE56 pKa = 4.48STEE59 pKa = 4.86DD60 pKa = 3.06EE61 pKa = 4.46WNEE64 pKa = 3.94EE65 pKa = 4.01FYY67 pKa = 11.2LPYY70 pKa = 9.91LTDD73 pKa = 3.27IAADD77 pKa = 3.63NVRR80 pKa = 11.84DD81 pKa = 3.88IVDD84 pKa = 4.97DD85 pKa = 3.43ICEE88 pKa = 4.01EE89 pKa = 3.99FGLFGEE95 pKa = 5.08FVAYY99 pKa = 9.79EE100 pKa = 4.0MDD102 pKa = 3.28MGSSEE107 pKa = 4.13RR108 pKa = 11.84CEE110 pKa = 3.97FTVVFAKK117 pKa = 10.56EE118 pKa = 4.26GIEE121 pKa = 3.92FDD123 pKa = 3.34IDD125 pKa = 3.82EE126 pKa = 4.43IMEE129 pKa = 4.27KK130 pKa = 11.03LEE132 pKa = 3.99LL133 pKa = 4.55
Molecular weight: 15.74 kDa
Isoelectric point according different methods:
Protein with the highest isoelectric point:
>tr|A0A1T4Y8E7|A0A1T4Y8E7_9CLOT LysR substrate binding domain-containing protein OS=Caloramator quimbayensis OX=1147123 GN=SAMN05443428_1274 PE=4 SV=1
MM1 pKa = 7.45LRR3 pKa = 11.84TYY5 pKa = 9.8QPKK8 pKa = 9.46KK9 pKa = 8.28RR10 pKa = 11.84QRR12 pKa = 11.84KK13 pKa = 8.39KK14 pKa = 8.49EE15 pKa = 3.5HH16 pKa = 6.11GFRR19 pKa = 11.84KK20 pKa = 9.7RR21 pKa = 11.84MKK23 pKa = 8.35TRR25 pKa = 11.84SGRR28 pKa = 11.84LVLQRR33 pKa = 11.84RR34 pKa = 11.84RR35 pKa = 11.84RR36 pKa = 11.84KK37 pKa = 9.44GRR39 pKa = 11.84KK40 pKa = 9.05KK41 pKa = 9.62LTAA44 pKa = 4.2
MM1 pKa = 7.45LRR3 pKa = 11.84TYY5 pKa = 9.8QPKK8 pKa = 9.46KK9 pKa = 8.28RR10 pKa = 11.84QRR12 pKa = 11.84KK13 pKa = 8.39KK14 pKa = 8.49EE15 pKa = 3.5HH16 pKa = 6.11GFRR19 pKa = 11.84KK20 pKa = 9.7RR21 pKa = 11.84MKK23 pKa = 8.35TRR25 pKa = 11.84SGRR28 pKa = 11.84LVLQRR33 pKa = 11.84RR34 pKa = 11.84RR35 pKa = 11.84RR36 pKa = 11.84KK37 pKa = 9.44GRR39 pKa = 11.84KK40 pKa = 9.05KK41 pKa = 9.62LTAA44 pKa = 4.2
Molecular weight: 5.55 kDa
Isoelectric point according different methods:
Peptides (in silico digests for buttom-up proteomics)
Below you can find in silico digests of the whole proteome with Trypsin, Chymotrypsin, Trypsin+LysC, LysN, ArgC proteases suitable for different mass spec machines.| Try ESI |
 |
|---|
| ChTry ESI |
|
|---|
| ArgC ESI |
|
|---|
| LysN ESI |
|
|---|
| TryLysC ESI |
|
|---|
| Try MALDI |
|
|---|
| ChTry MALDI |
|
|---|
| ArgC MALDI |
|
|---|
| LysN MALDI |
|
|---|
| TryLysC MALDI |
|
|---|
| Try LTQ |
|
|---|
| ChTry LTQ |
|
|---|
| ArgC LTQ |
|
|---|
| LysN LTQ |
|
|---|
| TryLysC LTQ |
|
|---|
| Try MSlow |
|
|---|
| ChTry MSlow |
|
|---|
| ArgC MSlow |
|
|---|
| LysN MSlow |
|
|---|
| TryLysC MSlow |
|
|---|
| Try MShigh |
|
|---|
| ChTry MShigh |
|
|---|
| ArgC MShigh |
|
|---|
| LysN MShigh |
|
|---|
| TryLysC MShigh |
|
|---|
General Statistics
Number of major isoforms |
Number of additional isoforms |
Number of all proteins |
Number of amino acids |
Min. Seq. Length |
Max. Seq. Length |
Avg. Seq. Length |
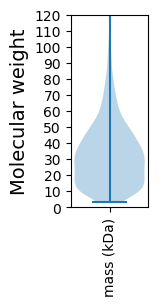
Avg. Mol. Weight |
|---|---|---|---|---|---|---|---|
0 |
921638 |
25 |
2731 |
307.6 |
34.78 |
Amino acid frequency
Ala |
Cys |
Asp |
Glu |
Phe |
Gly |
His |
Ile |
Lys |
Leu |
|---|---|---|---|---|---|---|---|---|---|
5.854 ± 0.056 | 1.268 ± 0.021 |
5.669 ± 0.034 | 7.181 ± 0.051 |
4.497 ± 0.032 | 6.369 ± 0.049 |
1.281 ± 0.016 | 10.42 ± 0.048 |
9.202 ± 0.05 | 8.835 ± 0.04 |
Met |
Asn |
Gln |
Pro |
Arg |
Ser |
Thr |
Val |
Trp |
Tyr |
|---|---|---|---|---|---|---|---|---|---|
2.581 ± 0.021 | 5.956 ± 0.045 |
2.986 ± 0.024 | 2.272 ± 0.024 |
3.576 ± 0.035 | 6.204 ± 0.045 |
4.539 ± 0.034 | 6.295 ± 0.04 |
0.655 ± 0.014 | 4.359 ± 0.037 |
Most of the basic statistics you can see at this page can be downloaded from this CSV file
See this proteome in:

Proteome-pI is available under Creative Commons Attribution-NoDerivs license, for more details see here
| Reference: Kozlowski LP. Proteome-pI 2.0: Proteome Isoelectric Point Database Update. Nucleic Acids Res. 2021, doi: 10.1093/nar/gkab944 | Contact: Lukasz P. Kozlowski |