Vibrio phage vB_VhaM_VH-8
Taxonomy: Viruses; Duplodnaviria; Heunggongvirae; Uroviricota; Caudoviricetes; Caudovirales; Myoviridae; unclassified Myoviridae
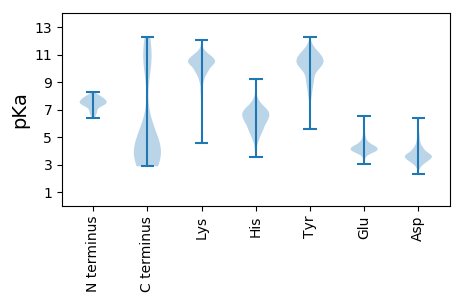
Average proteome isoelectric point is 6.1
Get precalculated fractions of proteins

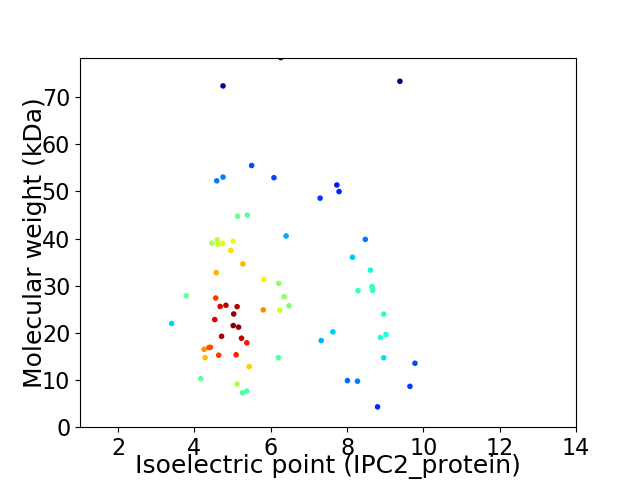
Virtual 2D-PAGE plot for 70 proteins (isoelectric point calculated using IPC2_protein)
Get csv file with sequences according to given criteria:
* You can choose from 21 different methods for calculating isoelectric point
Summary statistics related to proteome-wise predictions


Protein with the lowest isoelectric point:
>tr|A0A5Q2WBJ0|A0A5Q2WBJ0_9CAUD Glutaredoxin OS=Vibrio phage vB_VhaM_VH-8 OX=2660693 PE=4 SV=1
MM1 pKa = 6.51TTYY4 pKa = 9.24ITDD7 pKa = 3.65IKK9 pKa = 10.63QAATVLADD17 pKa = 3.71NNIEE21 pKa = 4.87LITFEE26 pKa = 5.26HH27 pKa = 6.75NISYY31 pKa = 7.79DD32 pKa = 3.29TGLSQMYY39 pKa = 10.06YY40 pKa = 11.05DD41 pKa = 4.26EE42 pKa = 5.93FINNADD48 pKa = 3.42GCHH51 pKa = 6.2DD52 pKa = 3.55VQGFEE57 pKa = 4.34NYY59 pKa = 10.1LVIYY63 pKa = 10.21GSDD66 pKa = 2.98VSRR69 pKa = 11.84NDD71 pKa = 2.95RR72 pKa = 11.84HH73 pKa = 6.38FDD75 pKa = 3.29EE76 pKa = 6.39HH77 pKa = 6.63EE78 pKa = 4.29LSLLSDD84 pKa = 3.79NEE86 pKa = 4.35LNDD89 pKa = 3.6LSYY92 pKa = 11.61SLGLSYY98 pKa = 10.83DD99 pKa = 3.42IDD101 pKa = 4.27DD102 pKa = 4.42KK103 pKa = 11.68QDD105 pKa = 4.7LIDD108 pKa = 4.38EE109 pKa = 4.69LLSLDD114 pKa = 3.78HH115 pKa = 6.69EE116 pKa = 4.94SYY118 pKa = 10.49YY119 pKa = 10.3IKK121 pKa = 10.65YY122 pKa = 10.29YY123 pKa = 10.86NEE125 pKa = 3.64TYY127 pKa = 10.87YY128 pKa = 11.06RR129 pKa = 11.84DD130 pKa = 3.36LNYY133 pKa = 10.82AFSFSGYY140 pKa = 9.18SQGDD144 pKa = 3.81SYY146 pKa = 11.53RR147 pKa = 11.84VQTVGNVEE155 pKa = 3.67TWLTDD160 pKa = 3.45DD161 pKa = 4.06YY162 pKa = 10.65LTHH165 pKa = 7.13LFYY168 pKa = 10.92GVPINGSVYY177 pKa = 10.3VYY179 pKa = 10.8INGEE183 pKa = 3.92LTDD186 pKa = 3.78EE187 pKa = 4.4LFVGEE192 pKa = 5.16MIDD195 pKa = 6.07DD196 pKa = 4.14SYY198 pKa = 12.27NWDD201 pKa = 3.11KK202 pKa = 10.29TQFINNVSNATLDD215 pKa = 3.48RR216 pKa = 11.84PYY218 pKa = 10.85HH219 pKa = 5.54VLLNQWLIDD228 pKa = 4.12NINDD232 pKa = 3.41EE233 pKa = 4.9LEE235 pKa = 3.86YY236 pKa = 10.95SYY238 pKa = 11.98
MM1 pKa = 6.51TTYY4 pKa = 9.24ITDD7 pKa = 3.65IKK9 pKa = 10.63QAATVLADD17 pKa = 3.71NNIEE21 pKa = 4.87LITFEE26 pKa = 5.26HH27 pKa = 6.75NISYY31 pKa = 7.79DD32 pKa = 3.29TGLSQMYY39 pKa = 10.06YY40 pKa = 11.05DD41 pKa = 4.26EE42 pKa = 5.93FINNADD48 pKa = 3.42GCHH51 pKa = 6.2DD52 pKa = 3.55VQGFEE57 pKa = 4.34NYY59 pKa = 10.1LVIYY63 pKa = 10.21GSDD66 pKa = 2.98VSRR69 pKa = 11.84NDD71 pKa = 2.95RR72 pKa = 11.84HH73 pKa = 6.38FDD75 pKa = 3.29EE76 pKa = 6.39HH77 pKa = 6.63EE78 pKa = 4.29LSLLSDD84 pKa = 3.79NEE86 pKa = 4.35LNDD89 pKa = 3.6LSYY92 pKa = 11.61SLGLSYY98 pKa = 10.83DD99 pKa = 3.42IDD101 pKa = 4.27DD102 pKa = 4.42KK103 pKa = 11.68QDD105 pKa = 4.7LIDD108 pKa = 4.38EE109 pKa = 4.69LLSLDD114 pKa = 3.78HH115 pKa = 6.69EE116 pKa = 4.94SYY118 pKa = 10.49YY119 pKa = 10.3IKK121 pKa = 10.65YY122 pKa = 10.29YY123 pKa = 10.86NEE125 pKa = 3.64TYY127 pKa = 10.87YY128 pKa = 11.06RR129 pKa = 11.84DD130 pKa = 3.36LNYY133 pKa = 10.82AFSFSGYY140 pKa = 9.18SQGDD144 pKa = 3.81SYY146 pKa = 11.53RR147 pKa = 11.84VQTVGNVEE155 pKa = 3.67TWLTDD160 pKa = 3.45DD161 pKa = 4.06YY162 pKa = 10.65LTHH165 pKa = 7.13LFYY168 pKa = 10.92GVPINGSVYY177 pKa = 10.3VYY179 pKa = 10.8INGEE183 pKa = 3.92LTDD186 pKa = 3.78EE187 pKa = 4.4LFVGEE192 pKa = 5.16MIDD195 pKa = 6.07DD196 pKa = 4.14SYY198 pKa = 12.27NWDD201 pKa = 3.11KK202 pKa = 10.29TQFINNVSNATLDD215 pKa = 3.48RR216 pKa = 11.84PYY218 pKa = 10.85HH219 pKa = 5.54VLLNQWLIDD228 pKa = 4.12NINDD232 pKa = 3.41EE233 pKa = 4.9LEE235 pKa = 3.86YY236 pKa = 10.95SYY238 pKa = 11.98
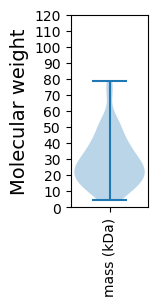
Molecular weight: 27.86 kDa
Isoelectric point according different methods:
Protein with the highest isoelectric point:
>tr|A0A5Q2WCS4|A0A5Q2WCS4_9CAUD HNH homing endonuclease OS=Vibrio phage vB_VhaM_VH-8 OX=2660693 PE=4 SV=1
MM1 pKa = 7.47TKK3 pKa = 10.57GLAQKK8 pKa = 9.86RR9 pKa = 11.84HH10 pKa = 4.86HH11 pKa = 6.98KK12 pKa = 10.24KK13 pKa = 9.78RR14 pKa = 11.84LKK16 pKa = 10.36NKK18 pKa = 8.77RR19 pKa = 11.84KK20 pKa = 9.67RR21 pKa = 11.84DD22 pKa = 3.15IFYY25 pKa = 10.21TKK27 pKa = 10.24GSPINKK33 pKa = 9.17HH34 pKa = 5.75VITPKK39 pKa = 10.64LCSCWLCGSPRR50 pKa = 11.84KK51 pKa = 9.83FSGNSKK57 pKa = 9.95HH58 pKa = 6.43GKK60 pKa = 7.85TIQEE64 pKa = 3.98LRR66 pKa = 11.84QKK68 pKa = 10.81EE69 pKa = 4.14KK70 pKa = 11.24DD71 pKa = 3.6NEE73 pKa = 4.37SS74 pKa = 3.17
MM1 pKa = 7.47TKK3 pKa = 10.57GLAQKK8 pKa = 9.86RR9 pKa = 11.84HH10 pKa = 4.86HH11 pKa = 6.98KK12 pKa = 10.24KK13 pKa = 9.78RR14 pKa = 11.84LKK16 pKa = 10.36NKK18 pKa = 8.77RR19 pKa = 11.84KK20 pKa = 9.67RR21 pKa = 11.84DD22 pKa = 3.15IFYY25 pKa = 10.21TKK27 pKa = 10.24GSPINKK33 pKa = 9.17HH34 pKa = 5.75VITPKK39 pKa = 10.64LCSCWLCGSPRR50 pKa = 11.84KK51 pKa = 9.83FSGNSKK57 pKa = 9.95HH58 pKa = 6.43GKK60 pKa = 7.85TIQEE64 pKa = 3.98LRR66 pKa = 11.84QKK68 pKa = 10.81EE69 pKa = 4.14KK70 pKa = 11.24DD71 pKa = 3.6NEE73 pKa = 4.37SS74 pKa = 3.17
Molecular weight: 8.66 kDa
Isoelectric point according different methods:
Peptides (in silico digests for buttom-up proteomics)
Below you can find in silico digests of the whole proteome with Trypsin, Chymotrypsin, Trypsin+LysC, LysN, ArgC proteases suitable for different mass spec machines.| Try ESI |
 |
|---|
| ChTry ESI |
 |
|---|
| ArgC ESI |
 |
|---|
| LysN ESI |
 |
|---|
| TryLysC ESI |
 |
|---|
| Try MALDI |
 |
|---|
| ChTry MALDI |
 |
|---|
| ArgC MALDI |
 |
|---|
| LysN MALDI |
 |
|---|
| TryLysC MALDI |
 |
|---|
| Try LTQ |
 |
|---|
| ChTry LTQ |
 |
|---|
| ArgC LTQ |
 |
|---|
| LysN LTQ |
 |
|---|
| TryLysC LTQ |
 |
|---|
| Try MSlow |
 |
|---|
| ChTry MSlow |
 |
|---|
| ArgC MSlow |
 |
|---|
| LysN MSlow |
 |
|---|
| TryLysC MSlow |
 |
|---|
| Try MShigh |
 |
|---|
| ChTry MShigh |
 |
|---|
| ArgC MShigh |
 |
|---|
| LysN MShigh |
 |
|---|
| TryLysC MShigh |
 |
|---|
General Statistics
Number of major isoforms |
Number of additional isoforms |
Number of all proteins |
Number of amino acids |
Min. Seq. Length |
Max. Seq. Length |
Avg. Seq. Length |
Avg. Mol. Weight |
|---|---|---|---|---|---|---|---|
0 |
17850 |
37 |
683 |
255.0 |
29.0 |
Amino acid frequency
Ala |
Cys |
Asp |
Glu |
Phe |
Gly |
His |
Ile |
Lys |
Leu |
|---|---|---|---|---|---|---|---|---|---|
5.289 ± 0.249 | 1.221 ± 0.118 |
6.756 ± 0.272 | 6.964 ± 0.25 |
3.832 ± 0.136 | 6.482 ± 0.303 |
1.955 ± 0.15 | 6.129 ± 0.26 |
7.961 ± 0.313 | 8.073 ± 0.223 |
Met |
Asn |
Gln |
Pro |
Arg |
Ser |
Thr |
Val |
Trp |
Tyr |
|---|---|---|---|---|---|---|---|---|---|
2.437 ± 0.164 | 6.129 ± 0.208 |
2.908 ± 0.127 | 3.232 ± 0.179 |
4.303 ± 0.171 | 7.322 ± 0.242 |
5.983 ± 0.256 | 6.706 ± 0.207 |
1.406 ± 0.079 | 4.913 ± 0.247 |
Most of the basic statistics you can see at this page can be downloaded from this CSV file
Proteome-pI is available under Creative Commons Attribution-NoDerivs license, for more details see here
| Reference: Kozlowski LP. Proteome-pI 2.0: Proteome Isoelectric Point Database Update. Nucleic Acids Res. 2021, doi: 10.1093/nar/gkab944 | Contact: Lukasz P. Kozlowski |
