Vibrio viridaestus
Taxonomy: cellular organisms; Bacteria; Proteobacteria; Gammaproteobacteria; Vibrionales; Vibrionaceae; Vibrio
Average proteome isoelectric point is 6.16
Get precalculated fractions of proteins

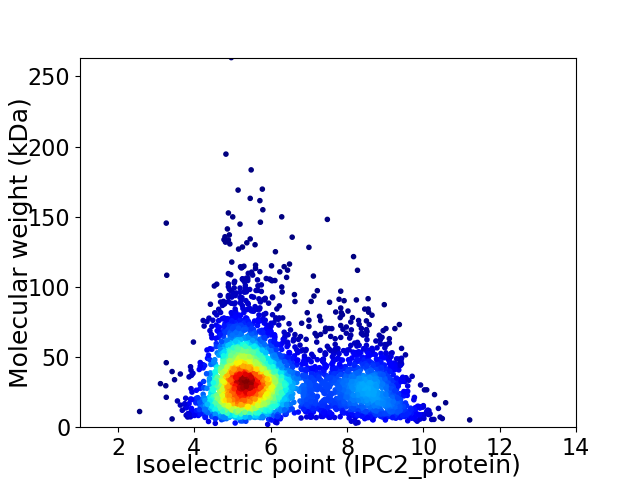
Virtual 2D-PAGE plot for 4277 proteins (isoelectric point calculated using IPC2_protein)
Get csv file with sequences according to given criteria:
* You can choose from 21 different methods for calculating isoelectric point
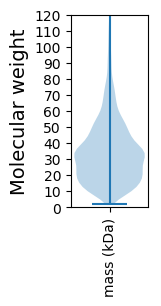
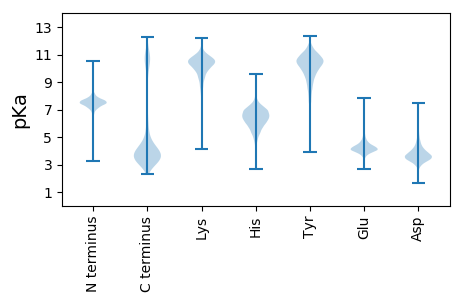
Summary statistics related to proteome-wise predictions


Protein with the lowest isoelectric point:
>tr|A0A3N9TIE4|A0A3N9TIE4_9VIBR HlyD family efflux transporter periplasmic adaptor subunit OS=Vibrio viridaestus OX=2487322 GN=EES38_10545 PE=3 SV=1
MM1 pKa = 7.65KK2 pKa = 10.41KK3 pKa = 10.03LLPVATGAFALLTLSGFAQAADD25 pKa = 3.78NDD27 pKa = 3.74YY28 pKa = 11.31GLYY31 pKa = 10.55VGGNYY36 pKa = 10.46GYY38 pKa = 11.25VKK40 pKa = 10.7VDD42 pKa = 3.45GQDD45 pKa = 5.18DD46 pKa = 4.0FDD48 pKa = 6.95DD49 pKa = 5.91DD50 pKa = 4.29NDD52 pKa = 3.87VYY54 pKa = 11.12QGLLGFRR61 pKa = 11.84FNKK64 pKa = 9.99YY65 pKa = 9.43LALEE69 pKa = 4.28GSYY72 pKa = 10.46IDD74 pKa = 3.94FGDD77 pKa = 3.72YY78 pKa = 10.77GKK80 pKa = 10.77SGASASTDD88 pKa = 3.1GYY90 pKa = 8.95TAALKK95 pKa = 10.54VIAPIGEE102 pKa = 4.03RR103 pKa = 11.84VEE105 pKa = 5.08LYY107 pKa = 10.99GKK109 pKa = 10.43GGQLWYY115 pKa = 8.93NTDD118 pKa = 3.42YY119 pKa = 11.51SVLGVNGSRR128 pKa = 11.84DD129 pKa = 3.75DD130 pKa = 3.81EE131 pKa = 4.7GVFAGAGVGFKK142 pKa = 9.59VTDD145 pKa = 3.42NFLVNVEE152 pKa = 4.26YY153 pKa = 9.3TWYY156 pKa = 10.38DD157 pKa = 2.99ADD159 pKa = 3.59IDD161 pKa = 4.06ADD163 pKa = 3.94AVSNGADD170 pKa = 3.28TEE172 pKa = 4.46TDD174 pKa = 3.93FKK176 pKa = 10.67QASVGVEE183 pKa = 3.67YY184 pKa = 10.87RR185 pKa = 11.84FF186 pKa = 3.62
MM1 pKa = 7.65KK2 pKa = 10.41KK3 pKa = 10.03LLPVATGAFALLTLSGFAQAADD25 pKa = 3.78NDD27 pKa = 3.74YY28 pKa = 11.31GLYY31 pKa = 10.55VGGNYY36 pKa = 10.46GYY38 pKa = 11.25VKK40 pKa = 10.7VDD42 pKa = 3.45GQDD45 pKa = 5.18DD46 pKa = 4.0FDD48 pKa = 6.95DD49 pKa = 5.91DD50 pKa = 4.29NDD52 pKa = 3.87VYY54 pKa = 11.12QGLLGFRR61 pKa = 11.84FNKK64 pKa = 9.99YY65 pKa = 9.43LALEE69 pKa = 4.28GSYY72 pKa = 10.46IDD74 pKa = 3.94FGDD77 pKa = 3.72YY78 pKa = 10.77GKK80 pKa = 10.77SGASASTDD88 pKa = 3.1GYY90 pKa = 8.95TAALKK95 pKa = 10.54VIAPIGEE102 pKa = 4.03RR103 pKa = 11.84VEE105 pKa = 5.08LYY107 pKa = 10.99GKK109 pKa = 10.43GGQLWYY115 pKa = 8.93NTDD118 pKa = 3.42YY119 pKa = 11.51SVLGVNGSRR128 pKa = 11.84DD129 pKa = 3.75DD130 pKa = 3.81EE131 pKa = 4.7GVFAGAGVGFKK142 pKa = 9.59VTDD145 pKa = 3.42NFLVNVEE152 pKa = 4.26YY153 pKa = 9.3TWYY156 pKa = 10.38DD157 pKa = 2.99ADD159 pKa = 3.59IDD161 pKa = 4.06ADD163 pKa = 3.94AVSNGADD170 pKa = 3.28TEE172 pKa = 4.46TDD174 pKa = 3.93FKK176 pKa = 10.67QASVGVEE183 pKa = 3.67YY184 pKa = 10.87RR185 pKa = 11.84FF186 pKa = 3.62
Molecular weight: 20.03 kDa
Isoelectric point according different methods:
Protein with the highest isoelectric point:
>tr|A0A3N9TBA4|A0A3N9TBA4_9VIBR Uncharacterized protein OS=Vibrio viridaestus OX=2487322 GN=EES38_21535 PE=4 SV=1
MM1 pKa = 7.45KK2 pKa = 9.5RR3 pKa = 11.84TFQPTVLKK11 pKa = 10.46RR12 pKa = 11.84KK13 pKa = 7.65RR14 pKa = 11.84THH16 pKa = 5.89GFRR19 pKa = 11.84ARR21 pKa = 11.84MATKK25 pKa = 10.44NGRR28 pKa = 11.84KK29 pKa = 9.39VINARR34 pKa = 11.84RR35 pKa = 11.84AKK37 pKa = 10.22GRR39 pKa = 11.84ARR41 pKa = 11.84LSKK44 pKa = 10.83
MM1 pKa = 7.45KK2 pKa = 9.5RR3 pKa = 11.84TFQPTVLKK11 pKa = 10.46RR12 pKa = 11.84KK13 pKa = 7.65RR14 pKa = 11.84THH16 pKa = 5.89GFRR19 pKa = 11.84ARR21 pKa = 11.84MATKK25 pKa = 10.44NGRR28 pKa = 11.84KK29 pKa = 9.39VINARR34 pKa = 11.84RR35 pKa = 11.84AKK37 pKa = 10.22GRR39 pKa = 11.84ARR41 pKa = 11.84LSKK44 pKa = 10.83
Molecular weight: 5.18 kDa
Isoelectric point according different methods:
Peptides (in silico digests for buttom-up proteomics)
Below you can find in silico digests of the whole proteome with Trypsin, Chymotrypsin, Trypsin+LysC, LysN, ArgC proteases suitable for different mass spec machines.| Try ESI |
 |
|---|
| ChTry ESI |
 |
|---|
| ArgC ESI |
 |
|---|
| LysN ESI |
 |
|---|
| TryLysC ESI |
 |
|---|
| Try MALDI |
 |
|---|
| ChTry MALDI |
 |
|---|
| ArgC MALDI |
 |
|---|
| LysN MALDI |
 |
|---|
| TryLysC MALDI |
 |
|---|
| Try LTQ |
 |
|---|
| ChTry LTQ |
 |
|---|
| ArgC LTQ |
 |
|---|
| LysN LTQ |
 |
|---|
| TryLysC LTQ |
 |
|---|
| Try MSlow |
 |
|---|
| ChTry MSlow |
 |
|---|
| ArgC MSlow |
 |
|---|
| LysN MSlow |
 |
|---|
| TryLysC MSlow |
 |
|---|
| Try MShigh |
 |
|---|
| ChTry MShigh |
 |
|---|
| ArgC MShigh |
 |
|---|
| LysN MShigh |
 |
|---|
| TryLysC MShigh |
 |
|---|
General Statistics
Number of major isoforms |
Number of additional isoforms |
Number of all proteins |
Number of amino acids |
Min. Seq. Length |
Max. Seq. Length |
Avg. Seq. Length |
Avg. Mol. Weight |
|---|---|---|---|---|---|---|---|
0 |
1367418 |
19 |
2360 |
319.7 |
35.59 |
Amino acid frequency
Ala |
Cys |
Asp |
Glu |
Phe |
Gly |
His |
Ile |
Lys |
Leu |
|---|---|---|---|---|---|---|---|---|---|
7.98 ± 0.037 | 1.096 ± 0.013 |
5.525 ± 0.027 | 6.218 ± 0.035 |
4.217 ± 0.026 | 6.739 ± 0.035 |
2.242 ± 0.018 | 7.007 ± 0.033 |
5.582 ± 0.03 | 10.273 ± 0.041 |
Met |
Asn |
Gln |
Pro |
Arg |
Ser |
Thr |
Val |
Trp |
Tyr |
|---|---|---|---|---|---|---|---|---|---|
2.642 ± 0.017 | 4.316 ± 0.023 |
3.816 ± 0.022 | 4.195 ± 0.028 |
4.429 ± 0.025 | 7.038 ± 0.031 |
5.314 ± 0.025 | 6.967 ± 0.029 |
1.239 ± 0.013 | 3.142 ± 0.02 |
Most of the basic statistics you can see at this page can be downloaded from this CSV file
Proteome-pI is available under Creative Commons Attribution-NoDerivs license, for more details see here
| Reference: Kozlowski LP. Proteome-pI 2.0: Proteome Isoelectric Point Database Update. Nucleic Acids Res. 2021, doi: 10.1093/nar/gkab944 | Contact: Lukasz P. Kozlowski |
