Capybara microvirus Cap1_SP_166
Taxonomy: Viruses; Monodnaviria; Sangervirae; Phixviricota; Malgrandaviricetes; Petitvirales; Microviridae; unclassified Microviridae
Average proteome isoelectric point is 5.77
Get precalculated fractions of proteins

Virtual 2D-PAGE plot for 6 proteins (isoelectric point calculated using IPC2_protein)
Get csv file with sequences according to given criteria:
* You can choose from 21 different methods for calculating isoelectric point
Summary statistics related to proteome-wise predictions


Protein with the lowest isoelectric point:
>tr|A0A4P8W492|A0A4P8W492_9VIRU Replication initiator protein OS=Capybara microvirus Cap1_SP_166 OX=2585401 PE=4 SV=1
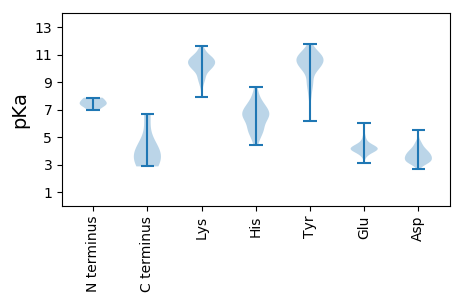
MM1 pKa = 7.45VKK3 pKa = 9.25MRR5 pKa = 11.84SAVDD9 pKa = 3.87FPTNAGSAFKK19 pKa = 10.31IKK21 pKa = 9.13YY22 pKa = 6.71TPHH25 pKa = 6.79VNEE28 pKa = 5.74DD29 pKa = 3.3GTIDD33 pKa = 3.57LVEE36 pKa = 4.17SEE38 pKa = 5.11KK39 pKa = 10.98INLQAEE45 pKa = 4.42IDD47 pKa = 3.89SHH49 pKa = 8.26FDD51 pKa = 3.38EE52 pKa = 6.02VDD54 pKa = 3.38MNSVMQRR61 pKa = 11.84FGLGDD66 pKa = 3.77TSAFSYY72 pKa = 10.94NPLYY76 pKa = 11.0GDD78 pKa = 3.25TTVYY82 pKa = 10.15PKK84 pKa = 10.25TYY86 pKa = 11.13AEE88 pKa = 4.0MLQLQMDD95 pKa = 4.03VDD97 pKa = 4.66RR98 pKa = 11.84YY99 pKa = 10.55FMQLPTSIKK108 pKa = 9.85EE109 pKa = 3.85AYY111 pKa = 9.86HH112 pKa = 5.45YY113 pKa = 10.56DD114 pKa = 3.49KK115 pKa = 11.45NQFFADD121 pKa = 3.17IGSEE125 pKa = 3.63RR126 pKa = 11.84WNNLMNPAPASPEE139 pKa = 4.01SPPEE143 pKa = 4.09VITNEE148 pKa = 4.1SS149 pKa = 3.07
MM1 pKa = 7.45VKK3 pKa = 9.25MRR5 pKa = 11.84SAVDD9 pKa = 3.87FPTNAGSAFKK19 pKa = 10.31IKK21 pKa = 9.13YY22 pKa = 6.71TPHH25 pKa = 6.79VNEE28 pKa = 5.74DD29 pKa = 3.3GTIDD33 pKa = 3.57LVEE36 pKa = 4.17SEE38 pKa = 5.11KK39 pKa = 10.98INLQAEE45 pKa = 4.42IDD47 pKa = 3.89SHH49 pKa = 8.26FDD51 pKa = 3.38EE52 pKa = 6.02VDD54 pKa = 3.38MNSVMQRR61 pKa = 11.84FGLGDD66 pKa = 3.77TSAFSYY72 pKa = 10.94NPLYY76 pKa = 11.0GDD78 pKa = 3.25TTVYY82 pKa = 10.15PKK84 pKa = 10.25TYY86 pKa = 11.13AEE88 pKa = 4.0MLQLQMDD95 pKa = 4.03VDD97 pKa = 4.66RR98 pKa = 11.84YY99 pKa = 10.55FMQLPTSIKK108 pKa = 9.85EE109 pKa = 3.85AYY111 pKa = 9.86HH112 pKa = 5.45YY113 pKa = 10.56DD114 pKa = 3.49KK115 pKa = 11.45NQFFADD121 pKa = 3.17IGSEE125 pKa = 3.63RR126 pKa = 11.84WNNLMNPAPASPEE139 pKa = 4.01SPPEE143 pKa = 4.09VITNEE148 pKa = 4.1SS149 pKa = 3.07
Molecular weight: 16.95 kDa
Isoelectric point according different methods:
Protein with the highest isoelectric point:
>tr|A0A4P8W815|A0A4P8W815_9VIRU Nonstructural protein OS=Capybara microvirus Cap1_SP_166 OX=2585401 PE=4 SV=1
MM1 pKa = 7.8IEE3 pKa = 4.01RR4 pKa = 11.84KK5 pKa = 10.17NEE7 pKa = 3.69VFLLDD12 pKa = 3.02ICSYY16 pKa = 9.71KK17 pKa = 10.54VYY19 pKa = 10.53YY20 pKa = 10.69SFVATIFILRR30 pKa = 11.84CFMLVKK36 pKa = 10.35VIITCARR43 pKa = 11.84CGHH46 pKa = 6.48RR47 pKa = 11.84SNRR50 pKa = 11.84KK51 pKa = 8.65IRR53 pKa = 11.84LGDD56 pKa = 3.53YY57 pKa = 11.0LMVRR61 pKa = 11.84HH62 pKa = 6.79DD63 pKa = 4.15RR64 pKa = 11.84QCSKK68 pKa = 10.82CLSTDD73 pKa = 3.44FDD75 pKa = 3.8IFIEE79 pKa = 4.32SFMEE83 pKa = 4.12VV84 pKa = 2.86
MM1 pKa = 7.8IEE3 pKa = 4.01RR4 pKa = 11.84KK5 pKa = 10.17NEE7 pKa = 3.69VFLLDD12 pKa = 3.02ICSYY16 pKa = 9.71KK17 pKa = 10.54VYY19 pKa = 10.53YY20 pKa = 10.69SFVATIFILRR30 pKa = 11.84CFMLVKK36 pKa = 10.35VIITCARR43 pKa = 11.84CGHH46 pKa = 6.48RR47 pKa = 11.84SNRR50 pKa = 11.84KK51 pKa = 8.65IRR53 pKa = 11.84LGDD56 pKa = 3.53YY57 pKa = 11.0LMVRR61 pKa = 11.84HH62 pKa = 6.79DD63 pKa = 4.15RR64 pKa = 11.84QCSKK68 pKa = 10.82CLSTDD73 pKa = 3.44FDD75 pKa = 3.8IFIEE79 pKa = 4.32SFMEE83 pKa = 4.12VV84 pKa = 2.86
Molecular weight: 10.04 kDa
Isoelectric point according different methods:
Peptides (in silico digests for buttom-up proteomics)
Below you can find in silico digests of the whole proteome with Trypsin, Chymotrypsin, Trypsin+LysC, LysN, ArgC proteases suitable for different mass spec machines.| Try ESI |
 |
|---|
| ChTry ESI |
 |
|---|
| ArgC ESI |
 |
|---|
| LysN ESI |
 |
|---|
| TryLysC ESI |
 |
|---|
| Try MALDI |
 |
|---|
| ChTry MALDI |
 |
|---|
| ArgC MALDI |
 |
|---|
| LysN MALDI |
 |
|---|
| TryLysC MALDI |
 |
|---|
| Try LTQ |
 |
|---|
| ChTry LTQ |
 |
|---|
| ArgC LTQ |
 |
|---|
| LysN LTQ |
 |
|---|
| TryLysC LTQ |
 |
|---|
| Try MSlow |
 |
|---|
| ChTry MSlow |
 |
|---|
| ArgC MSlow |
 |
|---|
| LysN MSlow |
 |
|---|
| TryLysC MSlow |
 |
|---|
| Try MShigh |
 |
|---|
| ChTry MShigh |
 |
|---|
| ArgC MShigh |
 |
|---|
| LysN MShigh |
 |
|---|
| TryLysC MShigh |
 |
|---|
General Statistics
Number of major isoforms |
Number of additional isoforms |
Number of all proteins |
Number of amino acids |
Min. Seq. Length |
Max. Seq. Length |
Avg. Seq. Length |
Avg. Mol. Weight |
|---|---|---|---|---|---|---|---|
0 |
1487 |
83 |
569 |
247.8 |
28.08 |
Amino acid frequency
Ala |
Cys |
Asp |
Glu |
Phe |
Gly |
His |
Ile |
Lys |
Leu |
|---|---|---|---|---|---|---|---|---|---|
6.994 ± 1.833 | 1.614 ± 0.722 |
7.128 ± 0.495 | 4.237 ± 0.434 |
5.514 ± 0.386 | 5.918 ± 0.581 |
3.295 ± 0.688 | 5.178 ± 0.824 |
4.506 ± 1.041 | 7.734 ± 0.85 |
Met |
Asn |
Gln |
Pro |
Arg |
Ser |
Thr |
Val |
Trp |
Tyr |
|---|---|---|---|---|---|---|---|---|---|
2.757 ± 0.532 | 4.707 ± 0.802 |
5.38 ± 0.665 | 3.766 ± 0.312 |
4.976 ± 0.582 | 8.675 ± 1.618 |
5.044 ± 0.448 | 5.851 ± 0.522 |
1.21 ± 0.208 | 5.514 ± 0.356 |
Most of the basic statistics you can see at this page can be downloaded from this CSV file
Proteome-pI is available under Creative Commons Attribution-NoDerivs license, for more details see here
| Reference: Kozlowski LP. Proteome-pI 2.0: Proteome Isoelectric Point Database Update. Nucleic Acids Res. 2021, doi: 10.1093/nar/gkab944 | Contact: Lukasz P. Kozlowski |
