Microbacterium sp. SUBG005
Taxonomy: cellular organisms; Bacteria; Terrabacteria group; Actinobacteria; Actinomycetia; Micrococcales; Microbacteriaceae; Microbacterium; unclassified Microbacterium
Average proteome isoelectric point is 6.32
Get precalculated fractions of proteins

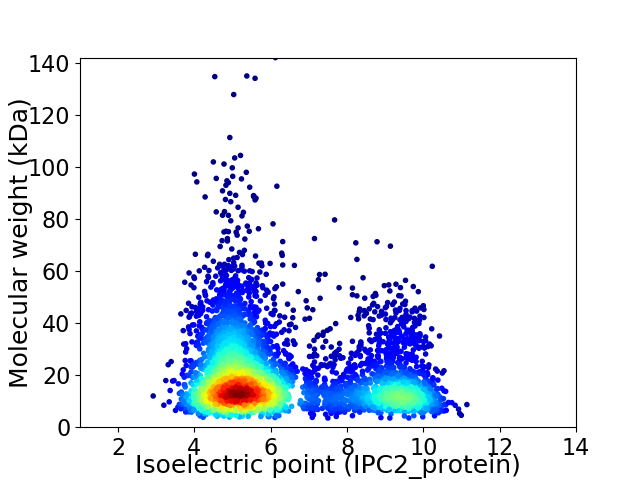
Virtual 2D-PAGE plot for 4595 proteins (isoelectric point calculated using IPC2_protein)
Get csv file with sequences according to given criteria:
* You can choose from 21 different methods for calculating isoelectric point
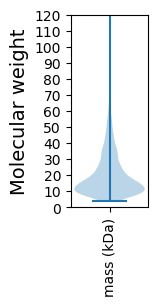
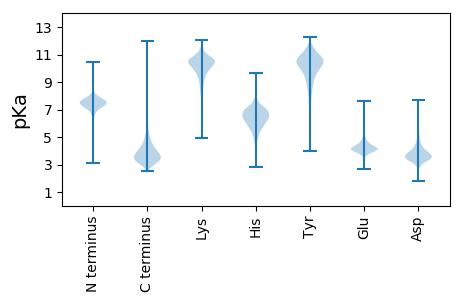
Summary statistics related to proteome-wise predictions


Protein with the lowest isoelectric point:
>tr|A0A074TP36|A0A074TP36_9MICO Uncharacterized protein (Fragment) OS=Microbacterium sp. SUBG005 OX=1504156 GN=HR12_13855 PE=4 SV=1
YYY2 pKa = 9.89AEEE5 pKa = 4.01VKKK8 pKa = 8.59TNGVSDDD15 pKa = 3.79VTWSGLEEE23 pKa = 3.73GNGKKK28 pKa = 9.7EE29 pKa = 4.47YYY31 pKa = 10.29LTAEEE36 pKa = 4.59ATGGHHH42 pKa = 6.35GTITGTGYYY51 pKa = 10.94DDD53 pKa = 3.2FIAEEE58 pKa = 4.68DD59 pKa = 3.31TYYY62 pKa = 9.71YYY64 pKa = 10.88GSGGWNTHHH73 pKa = 5.26DDD75 pKa = 3.42YY76 pKa = 10.81DD77 pKa = 3.69WSNTGGMDDD86 pKa = 3.57VDDD89 pKa = 3.99YY90 pKa = 11.29NATSGITVDDD100 pKa = 4.65RR101 pKa = 11.84LSTAQDDD108 pKa = 3.01GFGTTRR114 pKa = 11.84LLNIEEE120 pKa = 4.88INGSDDD126 pKa = 3.82YY127 pKa = 11.66DD128 pKa = 5.02DD129 pKa = 5.05ITGNSGDDD137 pKa = 3.65QFEEE141 pKa = 4.28RR142 pKa = 11.84GGNDDD147 pKa = 2.96FNIGSGGHHH156 pKa = 6.15DD157 pKa = 3.21LLYYY161 pKa = 10.78KK162 pKa = 10.76INASDDD168 pKa = 3.59TGGNGSDDD176 pKa = 3.46VNGFTVGTWEEE187 pKa = 4.2TADDD191 pKa = 3.59DDD193 pKa = 5.43IDDD196 pKa = 5.4RR197 pKa = 11.84DDD199 pKa = 3.72LSDDD203 pKa = 3.57GYYY206 pKa = 9.2GTGSASYYY214 pKa = 10.8NGVATLDDD222 pKa = 3.59SAGNIADDD230 pKa = 4.21YY231 pKa = 10.95RR232 pKa = 11.84VVQNGSNTEEE242 pKa = 3.85QVDDD246 pKa = 3.87DDD248 pKa = 3.68TGGQFTPTTLVTLNGXQTDDD268 pKa = 4.13ATLLANHHH276 pKa = 6.26LLIA
YYY2 pKa = 9.89AEEE5 pKa = 4.01VKKK8 pKa = 8.59TNGVSDDD15 pKa = 3.79VTWSGLEEE23 pKa = 3.73GNGKKK28 pKa = 9.7EE29 pKa = 4.47YYY31 pKa = 10.29LTAEEE36 pKa = 4.59ATGGHHH42 pKa = 6.35GTITGTGYYY51 pKa = 10.94DDD53 pKa = 3.2FIAEEE58 pKa = 4.68DD59 pKa = 3.31TYYY62 pKa = 9.71YYY64 pKa = 10.88GSGGWNTHHH73 pKa = 5.26DDD75 pKa = 3.42YY76 pKa = 10.81DD77 pKa = 3.69WSNTGGMDDD86 pKa = 3.57VDDD89 pKa = 3.99YY90 pKa = 11.29NATSGITVDDD100 pKa = 4.65RR101 pKa = 11.84LSTAQDDD108 pKa = 3.01GFGTTRR114 pKa = 11.84LLNIEEE120 pKa = 4.88INGSDDD126 pKa = 3.82YY127 pKa = 11.66DD128 pKa = 5.02DD129 pKa = 5.05ITGNSGDDD137 pKa = 3.65QFEEE141 pKa = 4.28RR142 pKa = 11.84GGNDDD147 pKa = 2.96FNIGSGGHHH156 pKa = 6.15DD157 pKa = 3.21LLYYY161 pKa = 10.78KK162 pKa = 10.76INASDDD168 pKa = 3.59TGGNGSDDD176 pKa = 3.46VNGFTVGTWEEE187 pKa = 4.2TADDD191 pKa = 3.59DDD193 pKa = 5.43IDDD196 pKa = 5.4RR197 pKa = 11.84DDD199 pKa = 3.72LSDDD203 pKa = 3.57GYYY206 pKa = 9.2GTGSASYYY214 pKa = 10.8NGVATLDDD222 pKa = 3.59SAGNIADDD230 pKa = 4.21YY231 pKa = 10.95RR232 pKa = 11.84VVQNGSNTEEE242 pKa = 3.85QVDDD246 pKa = 3.87DDD248 pKa = 3.68TGGQFTPTTLVTLNGXQTDDD268 pKa = 4.13ATLLANHHH276 pKa = 6.26LLIA
Molecular weight: 28.93 kDa
Isoelectric point according different methods:
Protein with the highest isoelectric point:
>tr|A0A074TZG7|A0A074TZG7_9MICO ATPase AAA OS=Microbacterium sp. SUBG005 OX=1504156 GN=HR12_23780 PE=4 SV=1
MM1 pKa = 7.13VFSSVASSSGMRR13 pKa = 11.84KK14 pKa = 9.32VNPSISTAPAAMLTAPIARR33 pKa = 11.84RR34 pKa = 11.84SFKK37 pKa = 10.44RR38 pKa = 11.84RR39 pKa = 11.84APAHH43 pKa = 5.46MRR45 pKa = 11.84PTATRR50 pKa = 11.84LVALPTAAAVSPPPAVSRR68 pKa = 11.84TFIAPQSRR76 pKa = 11.84AAMAATPKK84 pKa = 10.69
MM1 pKa = 7.13VFSSVASSSGMRR13 pKa = 11.84KK14 pKa = 9.32VNPSISTAPAAMLTAPIARR33 pKa = 11.84RR34 pKa = 11.84SFKK37 pKa = 10.44RR38 pKa = 11.84RR39 pKa = 11.84APAHH43 pKa = 5.46MRR45 pKa = 11.84PTATRR50 pKa = 11.84LVALPTAAAVSPPPAVSRR68 pKa = 11.84TFIAPQSRR76 pKa = 11.84AAMAATPKK84 pKa = 10.69
Molecular weight: 8.7 kDa
Isoelectric point according different methods:
Peptides (in silico digests for buttom-up proteomics)
Below you can find in silico digests of the whole proteome with Trypsin, Chymotrypsin, Trypsin+LysC, LysN, ArgC proteases suitable for different mass spec machines.| Try ESI |
 |
|---|
| ChTry ESI |
 |
|---|
| ArgC ESI |
 |
|---|
| LysN ESI |
 |
|---|
| TryLysC ESI |
 |
|---|
| Try MALDI |
 |
|---|
| ChTry MALDI |
 |
|---|
| ArgC MALDI |
 |
|---|
| LysN MALDI |
 |
|---|
| TryLysC MALDI |
 |
|---|
| Try LTQ |
 |
|---|
| ChTry LTQ |
 |
|---|
| ArgC LTQ |
 |
|---|
| LysN LTQ |
 |
|---|
| TryLysC LTQ |
 |
|---|
| Try MSlow |
 |
|---|
| ChTry MSlow |
 |
|---|
| ArgC MSlow |
 |
|---|
| LysN MSlow |
 |
|---|
| TryLysC MSlow |
 |
|---|
| Try MShigh |
 |
|---|
| ChTry MShigh |
 |
|---|
| ArgC MShigh |
 |
|---|
| LysN MShigh |
 |
|---|
| TryLysC MShigh |
 |
|---|
General Statistics
Number of major isoforms |
Number of additional isoforms |
Number of all proteins |
Number of amino acids |
Min. Seq. Length |
Max. Seq. Length |
Avg. Seq. Length |
Avg. Mol. Weight |
|---|---|---|---|---|---|---|---|
0 |
895786 |
33 |
1291 |
194.9 |
21.0 |
Amino acid frequency
Ala |
Cys |
Asp |
Glu |
Phe |
Gly |
His |
Ile |
Lys |
Leu |
|---|---|---|---|---|---|---|---|---|---|
12.852 ± 0.061 | 0.604 ± 0.011 |
6.264 ± 0.038 | 5.435 ± 0.036 |
3.409 ± 0.026 | 8.672 ± 0.04 |
2.042 ± 0.02 | 4.608 ± 0.034 |
2.286 ± 0.031 | 9.996 ± 0.048 |
Met |
Asn |
Gln |
Pro |
Arg |
Ser |
Thr |
Val |
Trp |
Tyr |
|---|---|---|---|---|---|---|---|---|---|
2.043 ± 0.022 | 2.219 ± 0.025 |
5.134 ± 0.031 | 3.033 ± 0.028 |
7.32 ± 0.047 | 5.658 ± 0.031 |
5.968 ± 0.03 | 8.854 ± 0.037 |
1.491 ± 0.018 | 2.079 ± 0.019 |
Most of the basic statistics you can see at this page can be downloaded from this CSV file
Proteome-pI is available under Creative Commons Attribution-NoDerivs license, for more details see here
| Reference: Kozlowski LP. Proteome-pI 2.0: Proteome Isoelectric Point Database Update. Nucleic Acids Res. 2021, doi: 10.1093/nar/gkab944 | Contact: Lukasz P. Kozlowski |
