Rotavirus A (isolate RVA/Monkey/South Africa/SA11-H96/1958/G3P5B[2]) (RV-A) (Simian Agent 11 (isolate SI/South Africa/H96/58))
Taxonomy: Viruses; Riboviria; Orthornavirae; Duplornaviricota; Resentoviricetes; Reovirales; Reoviridae; Sedoreovirinae; Rotavirus; Rotavirus A; Simian rotavirus A; Simian rotavirus A/SA11
Average proteome isoelectric point is 6.3
Get precalculated fractions of proteins

Virtual 2D-PAGE plot for 13 proteins (isoelectric point calculated using IPC2_protein)
Get csv file with sequences according to given criteria:
* You can choose from 21 different methods for calculating isoelectric point
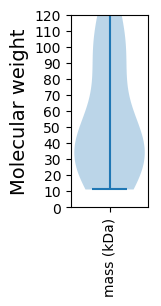
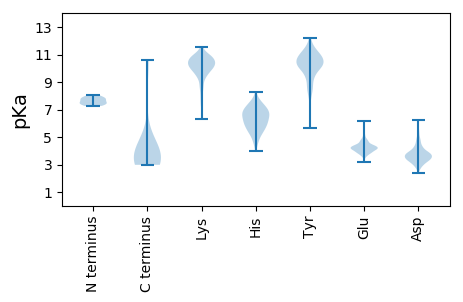
Summary statistics related to proteome-wise predictions


Protein with the lowest isoelectric point:
>sp|A2T3P5-2|VP7-2_ROTSH Isoform of A2T3P5 Isoform 2 of Outer capsid glycoprotein VP7 OS=Rotavirus A (isolate RVA/Monkey/South Africa/SA11-H96/1958/G3P5B[2]) OX=450149 PE=1 SV=1
MM1 pKa = 7.9DD2 pKa = 4.82FIIYY6 pKa = 10.0RR7 pKa = 11.84FLFIIVILSPFLRR20 pKa = 11.84AQNYY24 pKa = 8.58GINLPITGSMDD35 pKa = 3.06TAYY38 pKa = 10.65ANSTQEE44 pKa = 4.12EE45 pKa = 4.88TFLTSTLCLYY55 pKa = 10.75YY56 pKa = 8.86PTEE59 pKa = 4.27AATEE63 pKa = 4.11INDD66 pKa = 3.85NSWKK70 pKa = 9.38DD71 pKa = 3.5TLSQLFLTKK80 pKa = 10.05GWPTGSVYY88 pKa = 10.48FKK90 pKa = 10.03EE91 pKa = 4.3YY92 pKa = 10.64TNIASFSVDD101 pKa = 3.03PQLYY105 pKa = 9.31CDD107 pKa = 3.92YY108 pKa = 11.0NVVLMKK114 pKa = 10.53YY115 pKa = 10.24DD116 pKa = 3.35ATLQLDD122 pKa = 3.72MSEE125 pKa = 4.24LADD128 pKa = 5.13LILNEE133 pKa = 4.24WLCNPMDD140 pKa = 3.29ITLYY144 pKa = 10.67YY145 pKa = 9.25YY146 pKa = 10.55QQTDD150 pKa = 3.57EE151 pKa = 4.17ANKK154 pKa = 8.08WISMGSSCTIKK165 pKa = 10.46VCPLNTQTLGIGCLTTDD182 pKa = 2.57ATTFEE187 pKa = 4.44EE188 pKa = 4.7VATAEE193 pKa = 4.34KK194 pKa = 10.74LVITDD199 pKa = 3.22VVDD202 pKa = 4.31GVNHH206 pKa = 6.65KK207 pKa = 10.85LDD209 pKa = 3.69VTTATCTIRR218 pKa = 11.84NCKK221 pKa = 9.83KK222 pKa = 10.18LGPRR226 pKa = 11.84EE227 pKa = 4.01NVAVIQVGGSDD238 pKa = 3.65ILDD241 pKa = 3.33ITADD245 pKa = 3.74PTTAPQTEE253 pKa = 3.66RR254 pKa = 11.84MMRR257 pKa = 11.84INWKK261 pKa = 9.54KK262 pKa = 7.26WWQVFYY268 pKa = 10.57TVVDD272 pKa = 3.76YY273 pKa = 11.33VDD275 pKa = 4.77QIIQVMSKK283 pKa = 10.16RR284 pKa = 11.84SRR286 pKa = 11.84SLNSAAFYY294 pKa = 11.0YY295 pKa = 10.27RR296 pKa = 11.84VV297 pKa = 3.19
MM1 pKa = 7.9DD2 pKa = 4.82FIIYY6 pKa = 10.0RR7 pKa = 11.84FLFIIVILSPFLRR20 pKa = 11.84AQNYY24 pKa = 8.58GINLPITGSMDD35 pKa = 3.06TAYY38 pKa = 10.65ANSTQEE44 pKa = 4.12EE45 pKa = 4.88TFLTSTLCLYY55 pKa = 10.75YY56 pKa = 8.86PTEE59 pKa = 4.27AATEE63 pKa = 4.11INDD66 pKa = 3.85NSWKK70 pKa = 9.38DD71 pKa = 3.5TLSQLFLTKK80 pKa = 10.05GWPTGSVYY88 pKa = 10.48FKK90 pKa = 10.03EE91 pKa = 4.3YY92 pKa = 10.64TNIASFSVDD101 pKa = 3.03PQLYY105 pKa = 9.31CDD107 pKa = 3.92YY108 pKa = 11.0NVVLMKK114 pKa = 10.53YY115 pKa = 10.24DD116 pKa = 3.35ATLQLDD122 pKa = 3.72MSEE125 pKa = 4.24LADD128 pKa = 5.13LILNEE133 pKa = 4.24WLCNPMDD140 pKa = 3.29ITLYY144 pKa = 10.67YY145 pKa = 9.25YY146 pKa = 10.55QQTDD150 pKa = 3.57EE151 pKa = 4.17ANKK154 pKa = 8.08WISMGSSCTIKK165 pKa = 10.46VCPLNTQTLGIGCLTTDD182 pKa = 2.57ATTFEE187 pKa = 4.44EE188 pKa = 4.7VATAEE193 pKa = 4.34KK194 pKa = 10.74LVITDD199 pKa = 3.22VVDD202 pKa = 4.31GVNHH206 pKa = 6.65KK207 pKa = 10.85LDD209 pKa = 3.69VTTATCTIRR218 pKa = 11.84NCKK221 pKa = 9.83KK222 pKa = 10.18LGPRR226 pKa = 11.84EE227 pKa = 4.01NVAVIQVGGSDD238 pKa = 3.65ILDD241 pKa = 3.33ITADD245 pKa = 3.74PTTAPQTEE253 pKa = 3.66RR254 pKa = 11.84MMRR257 pKa = 11.84INWKK261 pKa = 9.54KK262 pKa = 7.26WWQVFYY268 pKa = 10.57TVVDD272 pKa = 3.76YY273 pKa = 11.33VDD275 pKa = 4.77QIIQVMSKK283 pKa = 10.16RR284 pKa = 11.84SRR286 pKa = 11.84SLNSAAFYY294 pKa = 11.0YY295 pKa = 10.27RR296 pKa = 11.84VV297 pKa = 3.19
Molecular weight: 33.81 kDa
Isoelectric point according different methods:
Protein with the highest isoelectric point:
>sp|A2T3R5|VP2_ROTSH Inner capsid protein VP2 OS=Rotavirus A (isolate RVA/Monkey/South Africa/SA11-H96/1958/G3P5B[2]) OX=450149 PE=1 SV=1
MM1 pKa = 7.42NRR3 pKa = 11.84LQQRR7 pKa = 11.84QLFLEE12 pKa = 4.16NLLVGVNSTFHH23 pKa = 6.05QMQKK27 pKa = 10.78HH28 pKa = 6.44SINTCCRR35 pKa = 11.84SLQRR39 pKa = 11.84ILDD42 pKa = 3.95HH43 pKa = 7.28LILLQTIHH51 pKa = 6.7SPVFRR56 pKa = 11.84LDD58 pKa = 3.41RR59 pKa = 11.84MQLRR63 pKa = 11.84QMQTLACLWIHH74 pKa = 5.54QHH76 pKa = 5.34NHH78 pKa = 6.38DD79 pKa = 4.51LQVMSDD85 pKa = 4.07AIKK88 pKa = 10.03WISPP92 pKa = 3.47
MM1 pKa = 7.42NRR3 pKa = 11.84LQQRR7 pKa = 11.84QLFLEE12 pKa = 4.16NLLVGVNSTFHH23 pKa = 6.05QMQKK27 pKa = 10.78HH28 pKa = 6.44SINTCCRR35 pKa = 11.84SLQRR39 pKa = 11.84ILDD42 pKa = 3.95HH43 pKa = 7.28LILLQTIHH51 pKa = 6.7SPVFRR56 pKa = 11.84LDD58 pKa = 3.41RR59 pKa = 11.84MQLRR63 pKa = 11.84QMQTLACLWIHH74 pKa = 5.54QHH76 pKa = 5.34NHH78 pKa = 6.38DD79 pKa = 4.51LQVMSDD85 pKa = 4.07AIKK88 pKa = 10.03WISPP92 pKa = 3.47
Molecular weight: 11.01 kDa
Isoelectric point according different methods:
Peptides (in silico digests for buttom-up proteomics)
Below you can find in silico digests of the whole proteome with Trypsin, Chymotrypsin, Trypsin+LysC, LysN, ArgC proteases suitable for different mass spec machines.| Try ESI |
 |
|---|
| ChTry ESI |
 |
|---|
| ArgC ESI |
 |
|---|
| LysN ESI |
 |
|---|
| TryLysC ESI |
 |
|---|
| Try MALDI |
 |
|---|
| ChTry MALDI |
 |
|---|
| ArgC MALDI |
 |
|---|
| LysN MALDI |
 |
|---|
| TryLysC MALDI |
 |
|---|
| Try LTQ |
 |
|---|
| ChTry LTQ |
 |
|---|
| ArgC LTQ |
 |
|---|
| LysN LTQ |
 |
|---|
| TryLysC LTQ |
 |
|---|
| Try MSlow |
 |
|---|
| ChTry MSlow |
 |
|---|
| ArgC MSlow |
 |
|---|
| LysN MSlow |
 |
|---|
| TryLysC MSlow |
 |
|---|
| Try MShigh |
 |
|---|
| ChTry MShigh |
 |
|---|
| ArgC MShigh |
 |
|---|
| LysN MShigh |
 |
|---|
| TryLysC MShigh |
 |
|---|
General Statistics
Number of major isoforms |
Number of additional isoforms |
Number of all proteins |
Number of amino acids |
Min. Seq. Length |
Max. Seq. Length |
Avg. Seq. Length |
Avg. Mol. Weight |
|---|---|---|---|---|---|---|---|
6194 |
92 |
1088 |
476.5 |
54.87 |
Amino acid frequency
Ala |
Cys |
Asp |
Glu |
Phe |
Gly |
His |
Ile |
Lys |
Leu |
|---|---|---|---|---|---|---|---|---|---|
5.344 ± 0.37 | 1.195 ± 0.321 |
6.087 ± 0.253 | 5.425 ± 0.293 |
4.391 ± 0.258 | 3.407 ± 0.313 |
1.55 ± 0.255 | 8.056 ± 0.325 |
6.345 ± 0.602 | 9.509 ± 0.395 |
Met |
Asn |
Gln |
Pro |
Arg |
Ser |
Thr |
Val |
Trp |
Tyr |
|---|---|---|---|---|---|---|---|---|---|
3.003 ± 0.246 | 6.991 ± 0.318 |
3.374 ± 0.308 | 4.294 ± 0.449 |
4.682 ± 0.297 | 7.588 ± 0.716 |
6.619 ± 0.626 | 6.006 ± 0.292 |
1.162 ± 0.137 | 4.973 ± 0.521 |
Most of the basic statistics you can see at this page can be downloaded from this CSV file
Proteome-pI is available under Creative Commons Attribution-NoDerivs license, for more details see here
| Reference: Kozlowski LP. Proteome-pI 2.0: Proteome Isoelectric Point Database Update. Nucleic Acids Res. 2021, doi: 10.1093/nar/gkab944 | Contact: Lukasz P. Kozlowski |
