Galactobacter caseinivorans
Taxonomy: cellular organisms; Bacteria; Terrabacteria group; Actinobacteria; Actinomycetia; Micrococcales; Micrococcaceae; Galactobacter
Average proteome isoelectric point is 6.32
Get precalculated fractions of proteins

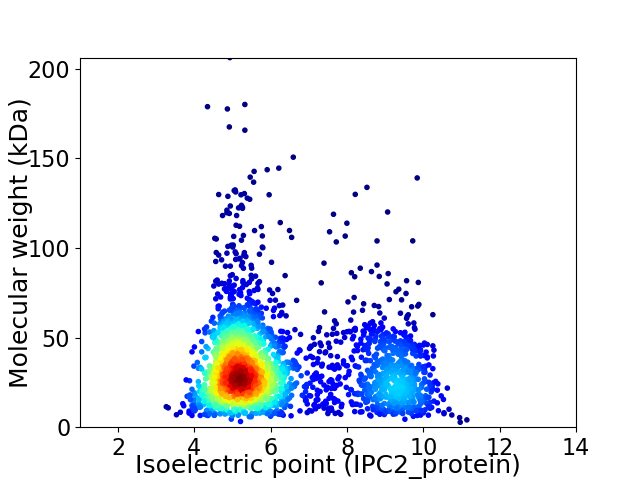
Virtual 2D-PAGE plot for 2599 proteins (isoelectric point calculated using IPC2_protein)
Get csv file with sequences according to given criteria:
* You can choose from 21 different methods for calculating isoelectric point
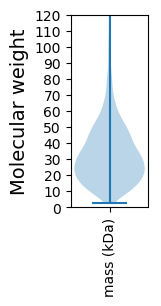
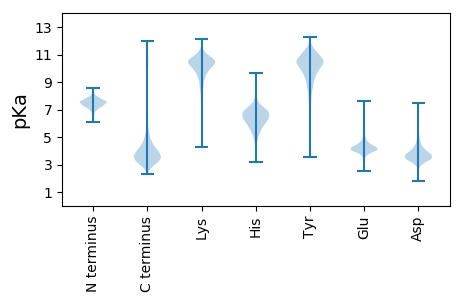
Summary statistics related to proteome-wise predictions


Protein with the lowest isoelectric point:
>tr|A0A496PHT0|A0A496PHT0_9MICC YhgE/Pip domain-containing protein OS=Galactobacter caseinivorans OX=2676123 GN=DWQ67_08730 PE=4 SV=1
MM1 pKa = 7.04TADD4 pKa = 3.12VHH6 pKa = 5.88QAQEE10 pKa = 4.39FYY12 pKa = 10.2GTLLGWEE19 pKa = 4.23FQGGDD24 pKa = 3.27EE25 pKa = 4.38EE26 pKa = 5.81KK27 pKa = 10.96YY28 pKa = 10.57GGYY31 pKa = 11.04LMAHH35 pKa = 6.69KK36 pKa = 10.55NGLPVAGMMQKK47 pKa = 9.91QPDD50 pKa = 4.18MADD53 pKa = 3.57MPDD56 pKa = 2.78VWTTYY61 pKa = 10.59LGSTSADD68 pKa = 3.19ASSAGALAAGGSVFFPPMDD87 pKa = 3.74VPDD90 pKa = 3.75QGIMGLVGDD99 pKa = 4.25TTGAAIGIWQPQPMSGFEE117 pKa = 4.0LTYY120 pKa = 10.84EE121 pKa = 4.15PGAPYY126 pKa = 9.87WFEE129 pKa = 4.2LFTRR133 pKa = 11.84DD134 pKa = 3.95FAGAQAFYY142 pKa = 11.02RR143 pKa = 11.84EE144 pKa = 4.24AFDD147 pKa = 3.21WDD149 pKa = 3.42ITVVSDD155 pKa = 3.75SDD157 pKa = 3.43EE158 pKa = 3.91FRR160 pKa = 11.84YY161 pKa = 8.69ATLGKK166 pKa = 10.25DD167 pKa = 3.04ADD169 pKa = 3.94SRR171 pKa = 11.84AGIMDD176 pKa = 4.25ASAFLPQGVPDD187 pKa = 3.66HH188 pKa = 6.08WRR190 pKa = 11.84VYY192 pKa = 10.72LGVEE196 pKa = 4.25DD197 pKa = 4.52AVAAAKK203 pKa = 10.04QVVALGGAILSGPEE217 pKa = 3.7DD218 pKa = 3.76TPYY221 pKa = 10.2GTVVSIADD229 pKa = 3.47PTGAMVLLASGYY241 pKa = 9.37PGNGG245 pKa = 3.05
MM1 pKa = 7.04TADD4 pKa = 3.12VHH6 pKa = 5.88QAQEE10 pKa = 4.39FYY12 pKa = 10.2GTLLGWEE19 pKa = 4.23FQGGDD24 pKa = 3.27EE25 pKa = 4.38EE26 pKa = 5.81KK27 pKa = 10.96YY28 pKa = 10.57GGYY31 pKa = 11.04LMAHH35 pKa = 6.69KK36 pKa = 10.55NGLPVAGMMQKK47 pKa = 9.91QPDD50 pKa = 4.18MADD53 pKa = 3.57MPDD56 pKa = 2.78VWTTYY61 pKa = 10.59LGSTSADD68 pKa = 3.19ASSAGALAAGGSVFFPPMDD87 pKa = 3.74VPDD90 pKa = 3.75QGIMGLVGDD99 pKa = 4.25TTGAAIGIWQPQPMSGFEE117 pKa = 4.0LTYY120 pKa = 10.84EE121 pKa = 4.15PGAPYY126 pKa = 9.87WFEE129 pKa = 4.2LFTRR133 pKa = 11.84DD134 pKa = 3.95FAGAQAFYY142 pKa = 11.02RR143 pKa = 11.84EE144 pKa = 4.24AFDD147 pKa = 3.21WDD149 pKa = 3.42ITVVSDD155 pKa = 3.75SDD157 pKa = 3.43EE158 pKa = 3.91FRR160 pKa = 11.84YY161 pKa = 8.69ATLGKK166 pKa = 10.25DD167 pKa = 3.04ADD169 pKa = 3.94SRR171 pKa = 11.84AGIMDD176 pKa = 4.25ASAFLPQGVPDD187 pKa = 3.66HH188 pKa = 6.08WRR190 pKa = 11.84VYY192 pKa = 10.72LGVEE196 pKa = 4.25DD197 pKa = 4.52AVAAAKK203 pKa = 10.04QVVALGGAILSGPEE217 pKa = 3.7DD218 pKa = 3.76TPYY221 pKa = 10.2GTVVSIADD229 pKa = 3.47PTGAMVLLASGYY241 pKa = 9.37PGNGG245 pKa = 3.05
Molecular weight: 25.94 kDa
Isoelectric point according different methods:
Protein with the highest isoelectric point:
>tr|A0A496PLD2|A0A496PLD2_9MICC Uncharacterized protein OS=Galactobacter caseinivorans OX=2676123 GN=DWQ67_00170 PE=4 SV=1
MM1 pKa = 7.4GSVIKK6 pKa = 10.42KK7 pKa = 8.47RR8 pKa = 11.84RR9 pKa = 11.84KK10 pKa = 9.22RR11 pKa = 11.84MAKK14 pKa = 9.41KK15 pKa = 9.87KK16 pKa = 9.7HH17 pKa = 5.84RR18 pKa = 11.84KK19 pKa = 8.56LLRR22 pKa = 11.84KK23 pKa = 7.78TRR25 pKa = 11.84HH26 pKa = 3.65QRR28 pKa = 11.84RR29 pKa = 11.84NKK31 pKa = 9.78KK32 pKa = 9.85
MM1 pKa = 7.4GSVIKK6 pKa = 10.42KK7 pKa = 8.47RR8 pKa = 11.84RR9 pKa = 11.84KK10 pKa = 9.22RR11 pKa = 11.84MAKK14 pKa = 9.41KK15 pKa = 9.87KK16 pKa = 9.7HH17 pKa = 5.84RR18 pKa = 11.84KK19 pKa = 8.56LLRR22 pKa = 11.84KK23 pKa = 7.78TRR25 pKa = 11.84HH26 pKa = 3.65QRR28 pKa = 11.84RR29 pKa = 11.84NKK31 pKa = 9.78KK32 pKa = 9.85
Molecular weight: 4.08 kDa
Isoelectric point according different methods:
Peptides (in silico digests for buttom-up proteomics)
Below you can find in silico digests of the whole proteome with Trypsin, Chymotrypsin, Trypsin+LysC, LysN, ArgC proteases suitable for different mass spec machines.| Try ESI |
 |
|---|
| ChTry ESI |
 |
|---|
| ArgC ESI |
 |
|---|
| LysN ESI |
 |
|---|
| TryLysC ESI |
 |
|---|
| Try MALDI |
 |
|---|
| ChTry MALDI |
 |
|---|
| ArgC MALDI |
 |
|---|
| LysN MALDI |
 |
|---|
| TryLysC MALDI |
 |
|---|
| Try LTQ |
 |
|---|
| ChTry LTQ |
 |
|---|
| ArgC LTQ |
 |
|---|
| LysN LTQ |
 |
|---|
| TryLysC LTQ |
 |
|---|
| Try MSlow |
 |
|---|
| ChTry MSlow |
 |
|---|
| ArgC MSlow |
 |
|---|
| LysN MSlow |
 |
|---|
| TryLysC MSlow |
 |
|---|
| Try MShigh |
 |
|---|
| ChTry MShigh |
 |
|---|
| ArgC MShigh |
 |
|---|
| LysN MShigh |
 |
|---|
| TryLysC MShigh |
 |
|---|
General Statistics
Number of major isoforms |
Number of additional isoforms |
Number of all proteins |
Number of amino acids |
Min. Seq. Length |
Max. Seq. Length |
Avg. Seq. Length |
Avg. Mol. Weight |
|---|---|---|---|---|---|---|---|
0 |
856916 |
24 |
1971 |
329.7 |
35.2 |
Amino acid frequency
Ala |
Cys |
Asp |
Glu |
Phe |
Gly |
His |
Ile |
Lys |
Leu |
|---|---|---|---|---|---|---|---|---|---|
13.519 ± 0.062 | 0.531 ± 0.01 |
5.508 ± 0.041 | 5.743 ± 0.051 |
2.92 ± 0.029 | 9.18 ± 0.041 |
2.078 ± 0.022 | 3.756 ± 0.04 |
2.643 ± 0.05 | 10.334 ± 0.058 |
Met |
Asn |
Gln |
Pro |
Arg |
Ser |
Thr |
Val |
Trp |
Tyr |
|---|---|---|---|---|---|---|---|---|---|
1.979 ± 0.02 | 2.098 ± 0.026 |
5.58 ± 0.042 | 3.522 ± 0.031 |
6.892 ± 0.055 | 5.967 ± 0.034 |
5.834 ± 0.034 | 8.601 ± 0.048 |
1.519 ± 0.02 | 1.795 ± 0.022 |
Most of the basic statistics you can see at this page can be downloaded from this CSV file
Proteome-pI is available under Creative Commons Attribution-NoDerivs license, for more details see here
| Reference: Kozlowski LP. Proteome-pI 2.0: Proteome Isoelectric Point Database Update. Nucleic Acids Res. 2021, doi: 10.1093/nar/gkab944 | Contact: Lukasz P. Kozlowski |
