Pantoea phage vB_PagP-SK1
Taxonomy: Viruses; Duplodnaviria; Heunggongvirae; Uroviricota; Caudoviricetes; Caudovirales; Autographiviridae; Studiervirinae; Elunavirus; unclassified Elunavirus
Average proteome isoelectric point is 6.3
Get precalculated fractions of proteins
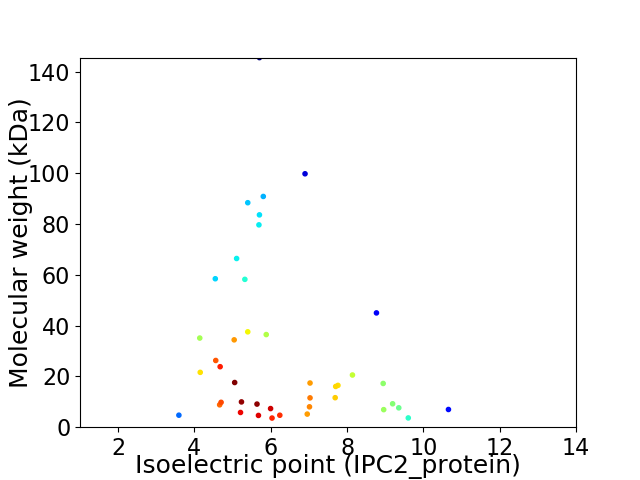
Virtual 2D-PAGE plot for 42 proteins (isoelectric point calculated using IPC2_protein)
Get csv file with sequences according to given criteria:
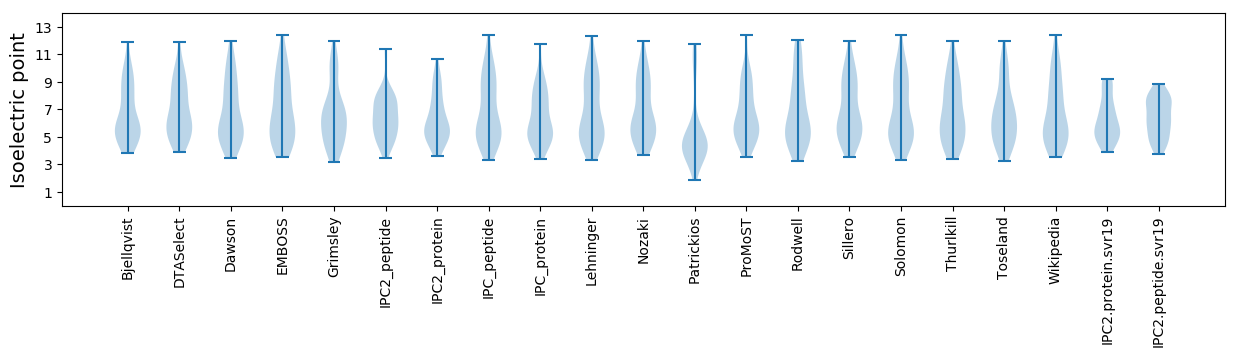
* You can choose from 21 different methods for calculating isoelectric point
Summary statistics related to proteome-wise predictions
Protein with the lowest isoelectric point:
>tr|A0A5P8NK79|A0A5P8NK79_9CAUD Major capsid protein OS=Pantoea phage vB_PagP-SK1 OX=2653646 PE=3 SV=1
MM1 pKa = 7.38GLSAFKK7 pKa = 10.89GIDD10 pKa = 2.92IMNDD14 pKa = 2.69INIWCAAFWILAAFIAGLAIGGVVCSDD41 pKa = 3.43TDD43 pKa = 3.71LDD45 pKa = 3.86
MM1 pKa = 7.38GLSAFKK7 pKa = 10.89GIDD10 pKa = 2.92IMNDD14 pKa = 2.69INIWCAAFWILAAFIAGLAIGGVVCSDD41 pKa = 3.43TDD43 pKa = 3.71LDD45 pKa = 3.86
Molecular weight: 4.73 kDa
Isoelectric point according different methods:
Protein with the highest isoelectric point:
>tr|A0A5P8NK59|A0A5P8NK59_9CAUD Endonuclease OS=Pantoea phage vB_PagP-SK1 OX=2653646 PE=4 SV=1
MM1 pKa = 7.43LQRR4 pKa = 11.84TRR6 pKa = 11.84WKK8 pKa = 10.08HH9 pKa = 4.2VKK11 pKa = 9.07QALYY15 pKa = 9.98MMAYY19 pKa = 9.52GASKK23 pKa = 10.5RR24 pKa = 11.84KK25 pKa = 9.51AKK27 pKa = 10.17RR28 pKa = 11.84VLKK31 pKa = 10.37RR32 pKa = 11.84GRR34 pKa = 11.84KK35 pKa = 5.71VTARR39 pKa = 11.84QAASAVKK46 pKa = 8.98WAEE49 pKa = 3.86FTLASPMKK57 pKa = 10.03IIKK60 pKa = 9.85
MM1 pKa = 7.43LQRR4 pKa = 11.84TRR6 pKa = 11.84WKK8 pKa = 10.08HH9 pKa = 4.2VKK11 pKa = 9.07QALYY15 pKa = 9.98MMAYY19 pKa = 9.52GASKK23 pKa = 10.5RR24 pKa = 11.84KK25 pKa = 9.51AKK27 pKa = 10.17RR28 pKa = 11.84VLKK31 pKa = 10.37RR32 pKa = 11.84GRR34 pKa = 11.84KK35 pKa = 5.71VTARR39 pKa = 11.84QAASAVKK46 pKa = 8.98WAEE49 pKa = 3.86FTLASPMKK57 pKa = 10.03IIKK60 pKa = 9.85
Molecular weight: 6.98 kDa
Isoelectric point according different methods:
Peptides (in silico digests for buttom-up proteomics)
Below you can find in silico digests of the whole proteome with Trypsin, Chymotrypsin, Trypsin+LysC, LysN, ArgC proteases suitable for different mass spec machines.| Try ESI |
 |
|---|
| ChTry ESI |
|
|---|
| ArgC ESI |
|
|---|
| LysN ESI |
|
|---|
| TryLysC ESI |
|
|---|
| Try MALDI |
|
|---|
| ChTry MALDI |
|
|---|
| ArgC MALDI |
|
|---|
| LysN MALDI |
|
|---|
| TryLysC MALDI |
|
|---|
| Try LTQ |
|
|---|
| ChTry LTQ |
|
|---|
| ArgC LTQ |
|
|---|
| LysN LTQ |
|
|---|
| TryLysC LTQ |
|
|---|
| Try MSlow |
|
|---|
| ChTry MSlow |
|
|---|
| ArgC MSlow |
|
|---|
| LysN MSlow |
|
|---|
| TryLysC MSlow |
|
|---|
| Try MShigh |
|
|---|
| ChTry MShigh |
|
|---|
| ArgC MShigh |
|
|---|
| LysN MShigh |
|
|---|
| TryLysC MShigh |
|
|---|
General Statistics
Number of major isoforms |
Number of additional isoforms |
Number of all proteins |
Number of amino acids |
Min. Seq. Length |
Max. Seq. Length |
Avg. Seq. Length |
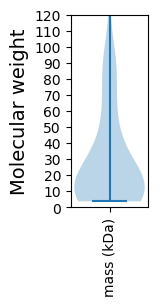
Avg. Mol. Weight |
|---|---|---|---|---|---|---|---|
0 |
11535 |
34 |
1332 |
274.6 |
30.38 |
Amino acid frequency
Ala |
Cys |
Asp |
Glu |
Phe |
Gly |
His |
Ile |
Lys |
Leu |
|---|---|---|---|---|---|---|---|---|---|
10.256 ± 0.462 | 0.806 ± 0.151 |
6.589 ± 0.296 | 6.589 ± 0.298 |
3.762 ± 0.2 | 8.071 ± 0.322 |
1.743 ± 0.167 | 4.889 ± 0.207 |
6.32 ± 0.341 | 7.776 ± 0.261 |
Met |
Asn |
Gln |
Pro |
Arg |
Ser |
Thr |
Val |
Trp |
Tyr |
|---|---|---|---|---|---|---|---|---|---|
2.861 ± 0.216 | 4.283 ± 0.208 |
3.676 ± 0.144 | 4.482 ± 0.344 |
5.375 ± 0.171 | 5.713 ± 0.256 |
5.566 ± 0.249 | 6.649 ± 0.276 |
1.439 ± 0.191 | 3.156 ± 0.172 |
Most of the basic statistics you can see at this page can be downloaded from this CSV file
See this proteome in:

Proteome-pI is available under Creative Commons Attribution-NoDerivs license, for more details see here
| Reference: Kozlowski LP. Proteome-pI 2.0: Proteome Isoelectric Point Database Update. Nucleic Acids Res. 2021, doi: 10.1093/nar/gkab944 | Contact: Lukasz P. Kozlowski |