Edwardsiella phage eiAU
Taxonomy: Viruses; Duplodnaviria; Heunggongvirae; Uroviricota; Caudoviricetes; Caudovirales; Siphoviridae; Eiauvirus; Edwardsiella virus eiAU
Average proteome isoelectric point is 6.55
Get precalculated fractions of proteins

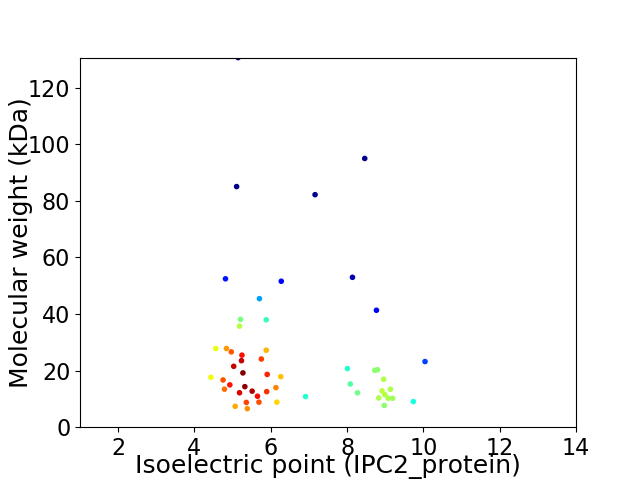
Virtual 2D-PAGE plot for 54 proteins (isoelectric point calculated using IPC2_protein)
Get csv file with sequences according to given criteria:
* You can choose from 21 different methods for calculating isoelectric point
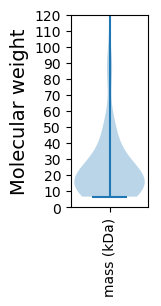
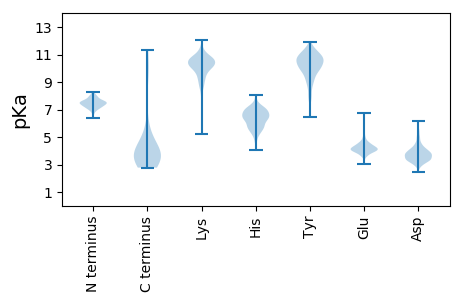
Summary statistics related to proteome-wise predictions


Protein with the lowest isoelectric point:
>tr|E7EKQ9|E7EKQ9_9CAUD Minor tail protein M OS=Edwardsiella phage eiAU OX=945083 GN=eiAUOrf20 PE=4 SV=1
MM1 pKa = 7.47TSYY4 pKa = 10.83IDD6 pKa = 3.62QSAKK10 pKa = 10.28LDD12 pKa = 3.65PSGRR16 pKa = 11.84IVLVEE21 pKa = 3.74VDD23 pKa = 3.64ASEE26 pKa = 4.69FGAGVHH32 pKa = 6.01RR33 pKa = 11.84MHH35 pKa = 6.92YY36 pKa = 10.89APFPHH41 pKa = 6.45SAAEE45 pKa = 3.97IEE47 pKa = 4.24AAAGDD52 pKa = 4.06EE53 pKa = 4.51AKK55 pKa = 10.68LGPKK59 pKa = 9.82PIYY62 pKa = 10.29FGGLMFDD69 pKa = 3.76FWPFSVSGLSLSTEE83 pKa = 3.99QAATPTITVSNLAGYY98 pKa = 10.13LSRR101 pKa = 11.84LCLDD105 pKa = 3.35YY106 pKa = 11.18RR107 pKa = 11.84DD108 pKa = 4.9LINAKK113 pKa = 9.52VRR115 pKa = 11.84VIYY118 pKa = 9.39TYY120 pKa = 11.33AEE122 pKa = 3.97YY123 pKa = 11.05LDD125 pKa = 4.42ARR127 pKa = 11.84NFPDD131 pKa = 4.22GNPNADD137 pKa = 4.14PDD139 pKa = 3.83ACSYY143 pKa = 7.6QTFWVDD149 pKa = 3.23TKK151 pKa = 11.01SAEE154 pKa = 4.23DD155 pKa = 4.23DD156 pKa = 4.27EE157 pKa = 6.16SITWTLSSPADD168 pKa = 3.73LQGLKK173 pKa = 10.07IPTRR177 pKa = 11.84QITSLCTWAMRR188 pKa = 11.84GQYY191 pKa = 10.04RR192 pKa = 11.84SGDD195 pKa = 3.2GCTYY199 pKa = 10.85NGNAYY204 pKa = 10.1FDD206 pKa = 4.21AKK208 pKa = 10.37GNPVSDD214 pKa = 4.3PALDD218 pKa = 3.61RR219 pKa = 11.84CGGCYY224 pKa = 9.84SDD226 pKa = 3.62CVKK229 pKa = 10.81RR230 pKa = 11.84FGADD234 pKa = 2.93MADD237 pKa = 3.66PKK239 pKa = 10.98AAALDD244 pKa = 3.89FGGFLAAQLINRR256 pKa = 4.72
MM1 pKa = 7.47TSYY4 pKa = 10.83IDD6 pKa = 3.62QSAKK10 pKa = 10.28LDD12 pKa = 3.65PSGRR16 pKa = 11.84IVLVEE21 pKa = 3.74VDD23 pKa = 3.64ASEE26 pKa = 4.69FGAGVHH32 pKa = 6.01RR33 pKa = 11.84MHH35 pKa = 6.92YY36 pKa = 10.89APFPHH41 pKa = 6.45SAAEE45 pKa = 3.97IEE47 pKa = 4.24AAAGDD52 pKa = 4.06EE53 pKa = 4.51AKK55 pKa = 10.68LGPKK59 pKa = 9.82PIYY62 pKa = 10.29FGGLMFDD69 pKa = 3.76FWPFSVSGLSLSTEE83 pKa = 3.99QAATPTITVSNLAGYY98 pKa = 10.13LSRR101 pKa = 11.84LCLDD105 pKa = 3.35YY106 pKa = 11.18RR107 pKa = 11.84DD108 pKa = 4.9LINAKK113 pKa = 9.52VRR115 pKa = 11.84VIYY118 pKa = 9.39TYY120 pKa = 11.33AEE122 pKa = 3.97YY123 pKa = 11.05LDD125 pKa = 4.42ARR127 pKa = 11.84NFPDD131 pKa = 4.22GNPNADD137 pKa = 4.14PDD139 pKa = 3.83ACSYY143 pKa = 7.6QTFWVDD149 pKa = 3.23TKK151 pKa = 11.01SAEE154 pKa = 4.23DD155 pKa = 4.23DD156 pKa = 4.27EE157 pKa = 6.16SITWTLSSPADD168 pKa = 3.73LQGLKK173 pKa = 10.07IPTRR177 pKa = 11.84QITSLCTWAMRR188 pKa = 11.84GQYY191 pKa = 10.04RR192 pKa = 11.84SGDD195 pKa = 3.2GCTYY199 pKa = 10.85NGNAYY204 pKa = 10.1FDD206 pKa = 4.21AKK208 pKa = 10.37GNPVSDD214 pKa = 4.3PALDD218 pKa = 3.61RR219 pKa = 11.84CGGCYY224 pKa = 9.84SDD226 pKa = 3.62CVKK229 pKa = 10.81RR230 pKa = 11.84FGADD234 pKa = 2.93MADD237 pKa = 3.66PKK239 pKa = 10.98AAALDD244 pKa = 3.89FGGFLAAQLINRR256 pKa = 4.72
Molecular weight: 27.81 kDa
Isoelectric point according different methods:
Protein with the highest isoelectric point:
>tr|W0LLX5|W0LLX5_9CAUD Structural protein OS=Edwardsiella phage eiAU OX=945083 GN=P858_43 PE=4 SV=1
MM1 pKa = 7.29QKK3 pKa = 10.59LIAYY7 pKa = 6.58ITAPMRR13 pKa = 11.84AIMKK17 pKa = 9.08YY18 pKa = 9.21RR19 pKa = 11.84RR20 pKa = 11.84EE21 pKa = 4.02AKK23 pKa = 9.74RR24 pKa = 11.84RR25 pKa = 11.84AFLQSAIEE33 pKa = 3.98KK34 pKa = 10.43ADD36 pKa = 3.8YY37 pKa = 9.81QWRR40 pKa = 11.84TLPRR44 pKa = 11.84AKK46 pKa = 9.68MYY48 pKa = 9.72NAEE51 pKa = 4.05RR52 pKa = 11.84RR53 pKa = 11.84RR54 pKa = 11.84LEE56 pKa = 3.9RR57 pKa = 11.84QLDD60 pKa = 3.72SMRR63 pKa = 11.84CEE65 pKa = 4.19LEE67 pKa = 4.56LMDD70 pKa = 6.1GRR72 pKa = 11.84LQQ74 pKa = 3.63
MM1 pKa = 7.29QKK3 pKa = 10.59LIAYY7 pKa = 6.58ITAPMRR13 pKa = 11.84AIMKK17 pKa = 9.08YY18 pKa = 9.21RR19 pKa = 11.84RR20 pKa = 11.84EE21 pKa = 4.02AKK23 pKa = 9.74RR24 pKa = 11.84RR25 pKa = 11.84AFLQSAIEE33 pKa = 3.98KK34 pKa = 10.43ADD36 pKa = 3.8YY37 pKa = 9.81QWRR40 pKa = 11.84TLPRR44 pKa = 11.84AKK46 pKa = 9.68MYY48 pKa = 9.72NAEE51 pKa = 4.05RR52 pKa = 11.84RR53 pKa = 11.84RR54 pKa = 11.84LEE56 pKa = 3.9RR57 pKa = 11.84QLDD60 pKa = 3.72SMRR63 pKa = 11.84CEE65 pKa = 4.19LEE67 pKa = 4.56LMDD70 pKa = 6.1GRR72 pKa = 11.84LQQ74 pKa = 3.63
Molecular weight: 9.07 kDa
Isoelectric point according different methods:
Peptides (in silico digests for buttom-up proteomics)
Below you can find in silico digests of the whole proteome with Trypsin, Chymotrypsin, Trypsin+LysC, LysN, ArgC proteases suitable for different mass spec machines.| Try ESI |
 |
|---|
| ChTry ESI |
 |
|---|
| ArgC ESI |
 |
|---|
| LysN ESI |
 |
|---|
| TryLysC ESI |
 |
|---|
| Try MALDI |
 |
|---|
| ChTry MALDI |
 |
|---|
| ArgC MALDI |
 |
|---|
| LysN MALDI |
 |
|---|
| TryLysC MALDI |
 |
|---|
| Try LTQ |
 |
|---|
| ChTry LTQ |
 |
|---|
| ArgC LTQ |
 |
|---|
| LysN LTQ |
 |
|---|
| TryLysC LTQ |
 |
|---|
| Try MSlow |
 |
|---|
| ChTry MSlow |
 |
|---|
| ArgC MSlow |
 |
|---|
| LysN MSlow |
 |
|---|
| TryLysC MSlow |
 |
|---|
| Try MShigh |
 |
|---|
| ChTry MShigh |
 |
|---|
| ArgC MShigh |
 |
|---|
| LysN MShigh |
 |
|---|
| TryLysC MShigh |
 |
|---|
General Statistics
Number of major isoforms |
Number of additional isoforms |
Number of all proteins |
Number of amino acids |
Min. Seq. Length |
Max. Seq. Length |
Avg. Seq. Length |
Avg. Mol. Weight |
|---|---|---|---|---|---|---|---|
0 |
12901 |
54 |
1203 |
238.9 |
26.16 |
Amino acid frequency
Ala |
Cys |
Asp |
Glu |
Phe |
Gly |
His |
Ile |
Lys |
Leu |
|---|---|---|---|---|---|---|---|---|---|
12.131 ± 0.487 | 1.24 ± 0.154 |
6.395 ± 0.309 | 6.069 ± 0.323 |
3.178 ± 0.178 | 8.178 ± 0.45 |
1.667 ± 0.227 | 5.046 ± 0.246 |
5.325 ± 0.341 | 7.798 ± 0.317 |
Met |
Asn |
Gln |
Pro |
Arg |
Ser |
Thr |
Val |
Trp |
Tyr |
|---|---|---|---|---|---|---|---|---|---|
2.651 ± 0.197 | 3.604 ± 0.189 |
4.201 ± 0.344 | 3.783 ± 0.296 |
6.511 ± 0.345 | 5.426 ± 0.347 |
5.899 ± 0.252 | 6.488 ± 0.31 |
1.481 ± 0.119 | 2.93 ± 0.199 |
Most of the basic statistics you can see at this page can be downloaded from this CSV file
Proteome-pI is available under Creative Commons Attribution-NoDerivs license, for more details see here
| Reference: Kozlowski LP. Proteome-pI 2.0: Proteome Isoelectric Point Database Update. Nucleic Acids Res. 2021, doi: 10.1093/nar/gkab944 | Contact: Lukasz P. Kozlowski |
