Vibrio mangrovi
Taxonomy: cellular organisms; Bacteria; Proteobacteria; Gammaproteobacteria; Vibrionales; Vibrionaceae; Vibrio
Average proteome isoelectric point is 6.1
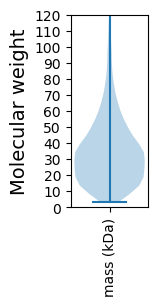
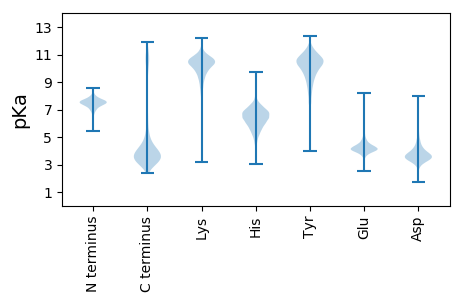
Get precalculated fractions of proteins

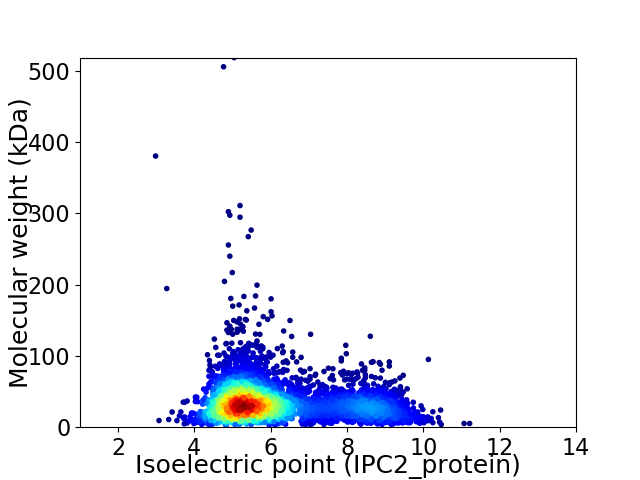
Virtual 2D-PAGE plot for 4312 proteins (isoelectric point calculated using IPC2_protein)
Get csv file with sequences according to given criteria:
* You can choose from 21 different methods for calculating isoelectric point
Summary statistics related to proteome-wise predictions


Protein with the lowest isoelectric point:
>tr|A0A1Y6IPN4|A0A1Y6IPN4_9VIBR Autoinducer 2-binding periplasmic protein LuxP OS=Vibrio mangrovi OX=474394 GN=lsrB PE=4 SV=1
MM1 pKa = 7.65KK2 pKa = 8.99KK3 pKa = 8.31TLIALAVLAAGSASAAEE20 pKa = 5.09IYY22 pKa = 10.35NQDD25 pKa = 3.09GVAVTVAGAGEE36 pKa = 4.23VQLMQAYY43 pKa = 8.26EE44 pKa = 3.89QDD46 pKa = 3.72GTDD49 pKa = 2.76VSTKK53 pKa = 10.57LRR55 pKa = 11.84IDD57 pKa = 3.97DD58 pKa = 3.93MQLNTHH64 pKa = 5.6GTIEE68 pKa = 4.2VAEE71 pKa = 4.36GLSAVVGLDD80 pKa = 3.24FTFEE84 pKa = 4.78DD85 pKa = 4.91DD86 pKa = 4.02SSASKK91 pKa = 11.35GNVQTDD97 pKa = 3.33GSYY100 pKa = 11.16VGFAYY105 pKa = 9.64TDD107 pKa = 3.55YY108 pKa = 9.86GTITYY113 pKa = 9.06GRR115 pKa = 11.84QYY117 pKa = 11.1LITDD121 pKa = 3.79DD122 pKa = 4.25SGIGADD128 pKa = 4.88FEE130 pKa = 4.76TGKK133 pKa = 9.59NQYY136 pKa = 9.25GQEE139 pKa = 4.15TTVGKK144 pKa = 10.26DD145 pKa = 3.15VIKK148 pKa = 10.68YY149 pKa = 10.18VYY151 pKa = 10.78DD152 pKa = 3.29NGTFYY157 pKa = 11.07FGLSHH162 pKa = 7.54DD163 pKa = 4.41LDD165 pKa = 3.93EE166 pKa = 6.31SEE168 pKa = 4.6GTTIDD173 pKa = 3.26ATSTDD178 pKa = 2.86GRR180 pKa = 11.84IGFRR184 pKa = 11.84YY185 pKa = 9.62EE186 pKa = 3.74GLDD189 pKa = 3.2ARR191 pKa = 11.84LYY193 pKa = 10.14IYY195 pKa = 10.89SGDD198 pKa = 3.94DD199 pKa = 3.18VDD201 pKa = 4.79ISSTATGDD209 pKa = 3.31EE210 pKa = 4.27DD211 pKa = 4.5SFNLEE216 pKa = 3.4VTYY219 pKa = 11.0EE220 pKa = 3.68MDD222 pKa = 3.42AFNFGASYY230 pKa = 10.57GQTEE234 pKa = 4.26QDD236 pKa = 2.86NTAGVEE242 pKa = 4.13VTDD245 pKa = 3.96RR246 pKa = 11.84DD247 pKa = 3.66IIEE250 pKa = 4.5LVGSYY255 pKa = 10.29TMDD258 pKa = 2.85KK259 pKa = 8.34TTFSLGYY266 pKa = 9.11VHH268 pKa = 6.95NDD270 pKa = 3.17DD271 pKa = 4.04NTSVSNDD278 pKa = 2.59GDD280 pKa = 3.54NLYY283 pKa = 11.18GVVVYY288 pKa = 10.69KK289 pKa = 10.36MNANVRR295 pKa = 11.84TYY297 pKa = 11.45AEE299 pKa = 3.95VGFYY303 pKa = 10.83DD304 pKa = 4.68DD305 pKa = 6.16DD306 pKa = 4.6SNKK309 pKa = 10.73DD310 pKa = 3.25YY311 pKa = 11.53DD312 pKa = 3.7PAYY315 pKa = 8.79TLGMEE320 pKa = 4.52VKK322 pKa = 10.57FF323 pKa = 4.41
MM1 pKa = 7.65KK2 pKa = 8.99KK3 pKa = 8.31TLIALAVLAAGSASAAEE20 pKa = 5.09IYY22 pKa = 10.35NQDD25 pKa = 3.09GVAVTVAGAGEE36 pKa = 4.23VQLMQAYY43 pKa = 8.26EE44 pKa = 3.89QDD46 pKa = 3.72GTDD49 pKa = 2.76VSTKK53 pKa = 10.57LRR55 pKa = 11.84IDD57 pKa = 3.97DD58 pKa = 3.93MQLNTHH64 pKa = 5.6GTIEE68 pKa = 4.2VAEE71 pKa = 4.36GLSAVVGLDD80 pKa = 3.24FTFEE84 pKa = 4.78DD85 pKa = 4.91DD86 pKa = 4.02SSASKK91 pKa = 11.35GNVQTDD97 pKa = 3.33GSYY100 pKa = 11.16VGFAYY105 pKa = 9.64TDD107 pKa = 3.55YY108 pKa = 9.86GTITYY113 pKa = 9.06GRR115 pKa = 11.84QYY117 pKa = 11.1LITDD121 pKa = 3.79DD122 pKa = 4.25SGIGADD128 pKa = 4.88FEE130 pKa = 4.76TGKK133 pKa = 9.59NQYY136 pKa = 9.25GQEE139 pKa = 4.15TTVGKK144 pKa = 10.26DD145 pKa = 3.15VIKK148 pKa = 10.68YY149 pKa = 10.18VYY151 pKa = 10.78DD152 pKa = 3.29NGTFYY157 pKa = 11.07FGLSHH162 pKa = 7.54DD163 pKa = 4.41LDD165 pKa = 3.93EE166 pKa = 6.31SEE168 pKa = 4.6GTTIDD173 pKa = 3.26ATSTDD178 pKa = 2.86GRR180 pKa = 11.84IGFRR184 pKa = 11.84YY185 pKa = 9.62EE186 pKa = 3.74GLDD189 pKa = 3.2ARR191 pKa = 11.84LYY193 pKa = 10.14IYY195 pKa = 10.89SGDD198 pKa = 3.94DD199 pKa = 3.18VDD201 pKa = 4.79ISSTATGDD209 pKa = 3.31EE210 pKa = 4.27DD211 pKa = 4.5SFNLEE216 pKa = 3.4VTYY219 pKa = 11.0EE220 pKa = 3.68MDD222 pKa = 3.42AFNFGASYY230 pKa = 10.57GQTEE234 pKa = 4.26QDD236 pKa = 2.86NTAGVEE242 pKa = 4.13VTDD245 pKa = 3.96RR246 pKa = 11.84DD247 pKa = 3.66IIEE250 pKa = 4.5LVGSYY255 pKa = 10.29TMDD258 pKa = 2.85KK259 pKa = 8.34TTFSLGYY266 pKa = 9.11VHH268 pKa = 6.95NDD270 pKa = 3.17DD271 pKa = 4.04NTSVSNDD278 pKa = 2.59GDD280 pKa = 3.54NLYY283 pKa = 11.18GVVVYY288 pKa = 10.69KK289 pKa = 10.36MNANVRR295 pKa = 11.84TYY297 pKa = 11.45AEE299 pKa = 3.95VGFYY303 pKa = 10.83DD304 pKa = 4.68DD305 pKa = 6.16DD306 pKa = 4.6SNKK309 pKa = 10.73DD310 pKa = 3.25YY311 pKa = 11.53DD312 pKa = 3.7PAYY315 pKa = 8.79TLGMEE320 pKa = 4.52VKK322 pKa = 10.57FF323 pKa = 4.41
Molecular weight: 35.06 kDa
Isoelectric point according different methods:
Protein with the highest isoelectric point:
>tr|A0A1Y6IYJ9|A0A1Y6IYJ9_9VIBR Uncharacterized protein OS=Vibrio mangrovi OX=474394 GN=VIM7927_04064 PE=4 SV=1
MM1 pKa = 7.45KK2 pKa = 9.5RR3 pKa = 11.84TFQPTVLKK11 pKa = 10.46RR12 pKa = 11.84KK13 pKa = 7.65RR14 pKa = 11.84THH16 pKa = 5.89GFRR19 pKa = 11.84ARR21 pKa = 11.84MATKK25 pKa = 10.45NGRR28 pKa = 11.84KK29 pKa = 9.19VLNARR34 pKa = 11.84RR35 pKa = 11.84AKK37 pKa = 10.26GRR39 pKa = 11.84ARR41 pKa = 11.84LSKK44 pKa = 10.83
MM1 pKa = 7.45KK2 pKa = 9.5RR3 pKa = 11.84TFQPTVLKK11 pKa = 10.46RR12 pKa = 11.84KK13 pKa = 7.65RR14 pKa = 11.84THH16 pKa = 5.89GFRR19 pKa = 11.84ARR21 pKa = 11.84MATKK25 pKa = 10.45NGRR28 pKa = 11.84KK29 pKa = 9.19VLNARR34 pKa = 11.84RR35 pKa = 11.84AKK37 pKa = 10.26GRR39 pKa = 11.84ARR41 pKa = 11.84LSKK44 pKa = 10.83
Molecular weight: 5.18 kDa
Isoelectric point according different methods:
Peptides (in silico digests for buttom-up proteomics)
Below you can find in silico digests of the whole proteome with Trypsin, Chymotrypsin, Trypsin+LysC, LysN, ArgC proteases suitable for different mass spec machines.| Try ESI |
 |
|---|
| ChTry ESI |
 |
|---|
| ArgC ESI |
 |
|---|
| LysN ESI |
 |
|---|
| TryLysC ESI |
 |
|---|
| Try MALDI |
 |
|---|
| ChTry MALDI |
 |
|---|
| ArgC MALDI |
 |
|---|
| LysN MALDI |
 |
|---|
| TryLysC MALDI |
 |
|---|
| Try LTQ |
 |
|---|
| ChTry LTQ |
 |
|---|
| ArgC LTQ |
 |
|---|
| LysN LTQ |
 |
|---|
| TryLysC LTQ |
 |
|---|
| Try MSlow |
 |
|---|
| ChTry MSlow |
 |
|---|
| ArgC MSlow |
 |
|---|
| LysN MSlow |
 |
|---|
| TryLysC MSlow |
 |
|---|
| Try MShigh |
 |
|---|
| ChTry MShigh |
 |
|---|
| ArgC MShigh |
 |
|---|
| LysN MShigh |
 |
|---|
| TryLysC MShigh |
 |
|---|
General Statistics
Number of major isoforms |
Number of additional isoforms |
Number of all proteins |
Number of amino acids |
Min. Seq. Length |
Max. Seq. Length |
Avg. Seq. Length |
Avg. Mol. Weight |
|---|---|---|---|---|---|---|---|
0 |
1428354 |
29 |
4679 |
331.3 |
36.93 |
Amino acid frequency
Ala |
Cys |
Asp |
Glu |
Phe |
Gly |
His |
Ile |
Lys |
Leu |
|---|---|---|---|---|---|---|---|---|---|
8.251 ± 0.036 | 1.126 ± 0.016 |
5.386 ± 0.036 | 6.237 ± 0.038 |
4.025 ± 0.027 | 6.831 ± 0.034 |
2.557 ± 0.02 | 6.573 ± 0.04 |
4.672 ± 0.041 | 10.315 ± 0.05 |
Met |
Asn |
Gln |
Pro |
Arg |
Ser |
Thr |
Val |
Trp |
Tyr |
|---|---|---|---|---|---|---|---|---|---|
2.654 ± 0.02 | 3.881 ± 0.026 |
4.096 ± 0.025 | 5.022 ± 0.032 |
4.935 ± 0.032 | 6.713 ± 0.031 |
5.374 ± 0.042 | 6.854 ± 0.029 |
1.262 ± 0.016 | 3.235 ± 0.024 |
Most of the basic statistics you can see at this page can be downloaded from this CSV file
Proteome-pI is available under Creative Commons Attribution-NoDerivs license, for more details see here
| Reference: Kozlowski LP. Proteome-pI 2.0: Proteome Isoelectric Point Database Update. Nucleic Acids Res. 2021, doi: 10.1093/nar/gkab944 | Contact: Lukasz P. Kozlowski |
