Marinitoga camini virus 1
Taxonomy: Viruses; Duplodnaviria; Heunggongvirae; Uroviricota; Caudoviricetes; Caudovirales; Siphoviridae; unclassified Siphoviridae
Average proteome isoelectric point is 7.0
Get precalculated fractions of proteins

Virtual 2D-PAGE plot for 77 proteins (isoelectric point calculated using IPC2_protein)
Get csv file with sequences according to given criteria:
* You can choose from 21 different methods for calculating isoelectric point
Summary statistics related to proteome-wise predictions


Protein with the lowest isoelectric point:
>tr|A0A139ZPG3|A0A139ZPG3_9CAUD Chitin binding protein OS=Marinitoga camini virus 1 OX=1629954 GN=UF08_36 PE=4 SV=1
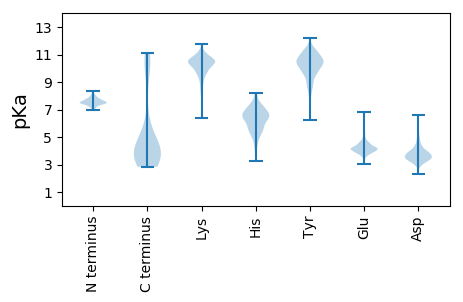
MM1 pKa = 7.5ALVKK5 pKa = 9.8TDD7 pKa = 3.32YY8 pKa = 11.54GLIYY12 pKa = 10.55NDD14 pKa = 5.02DD15 pKa = 3.69GSLCVTVRR23 pKa = 11.84DD24 pKa = 3.97DD25 pKa = 5.3DD26 pKa = 4.01IPFEE30 pKa = 4.35GVKK33 pKa = 10.46SFAVEE38 pKa = 3.87EE39 pKa = 4.69GTTNLITGDD48 pKa = 3.57SATFATSIGSWVEE61 pKa = 3.29SDD63 pKa = 3.91ANLTITWEE71 pKa = 4.1NIYY74 pKa = 11.21NEE76 pKa = 4.05FLKK79 pKa = 11.02QNGVMRR85 pKa = 11.84YY86 pKa = 9.57RR87 pKa = 11.84KK88 pKa = 7.88TDD90 pKa = 3.28SNNASCRR97 pKa = 11.84INITDD102 pKa = 3.67STLTTYY108 pKa = 10.58SGSIYY113 pKa = 10.24IKK115 pKa = 10.47LISGNINAIRR125 pKa = 11.84PAGVFYY131 pKa = 11.2YY132 pKa = 10.69SDD134 pKa = 3.93NTWTDD139 pKa = 3.65YY140 pKa = 11.53SWVDD144 pKa = 3.11ANGSYY149 pKa = 10.58KK150 pKa = 10.55RR151 pKa = 11.84IIDD154 pKa = 3.87MGNGIYY160 pKa = 10.18RR161 pKa = 11.84IEE163 pKa = 4.27VNNMKK168 pKa = 10.15YY169 pKa = 10.57DD170 pKa = 3.48QTKK173 pKa = 9.74IDD175 pKa = 3.66AGLTISKK182 pKa = 8.96FQIRR186 pKa = 11.84ITSPDD191 pKa = 3.26LVDD194 pKa = 5.0FYY196 pKa = 12.01VLAAQWEE203 pKa = 4.4QKK205 pKa = 10.27PFATSFVDD213 pKa = 3.74GTRR216 pKa = 11.84ADD218 pKa = 4.17GNLQLPWTMDD228 pKa = 2.99GYY230 pKa = 11.68NFVINLFAKK239 pKa = 10.6DD240 pKa = 4.35LFSSTNTNTHH250 pKa = 6.21IFNLGTTGLTDD261 pKa = 3.36VYY263 pKa = 10.79DD264 pKa = 3.57GRR266 pKa = 11.84LILRR270 pKa = 11.84QNNSLFQLYY279 pKa = 9.63IDD281 pKa = 4.84PADD284 pKa = 3.94GSASVSSNTSVASNDD299 pKa = 3.46GKK301 pKa = 10.96YY302 pKa = 10.6HH303 pKa = 6.0MLTVLVEE310 pKa = 4.09ATQARR315 pKa = 11.84LYY317 pKa = 10.49IDD319 pKa = 5.51GIYY322 pKa = 8.87KK323 pKa = 7.77TTLTYY328 pKa = 11.18DD329 pKa = 3.5FTKK332 pKa = 10.88EE333 pKa = 4.01NFDD336 pKa = 4.04KK337 pKa = 11.15LVLGSNISFSPVTAYY352 pKa = 10.69GLISNLYY359 pKa = 8.84IGNYY363 pKa = 9.4DD364 pKa = 3.59PNIWTDD370 pKa = 3.28AFIQEE375 pKa = 4.98LYY377 pKa = 8.71NAKK380 pKa = 10.26RR381 pKa = 11.84PFSVPAKK388 pKa = 10.53LPIII392 pKa = 4.4
MM1 pKa = 7.5ALVKK5 pKa = 9.8TDD7 pKa = 3.32YY8 pKa = 11.54GLIYY12 pKa = 10.55NDD14 pKa = 5.02DD15 pKa = 3.69GSLCVTVRR23 pKa = 11.84DD24 pKa = 3.97DD25 pKa = 5.3DD26 pKa = 4.01IPFEE30 pKa = 4.35GVKK33 pKa = 10.46SFAVEE38 pKa = 3.87EE39 pKa = 4.69GTTNLITGDD48 pKa = 3.57SATFATSIGSWVEE61 pKa = 3.29SDD63 pKa = 3.91ANLTITWEE71 pKa = 4.1NIYY74 pKa = 11.21NEE76 pKa = 4.05FLKK79 pKa = 11.02QNGVMRR85 pKa = 11.84YY86 pKa = 9.57RR87 pKa = 11.84KK88 pKa = 7.88TDD90 pKa = 3.28SNNASCRR97 pKa = 11.84INITDD102 pKa = 3.67STLTTYY108 pKa = 10.58SGSIYY113 pKa = 10.24IKK115 pKa = 10.47LISGNINAIRR125 pKa = 11.84PAGVFYY131 pKa = 11.2YY132 pKa = 10.69SDD134 pKa = 3.93NTWTDD139 pKa = 3.65YY140 pKa = 11.53SWVDD144 pKa = 3.11ANGSYY149 pKa = 10.58KK150 pKa = 10.55RR151 pKa = 11.84IIDD154 pKa = 3.87MGNGIYY160 pKa = 10.18RR161 pKa = 11.84IEE163 pKa = 4.27VNNMKK168 pKa = 10.15YY169 pKa = 10.57DD170 pKa = 3.48QTKK173 pKa = 9.74IDD175 pKa = 3.66AGLTISKK182 pKa = 8.96FQIRR186 pKa = 11.84ITSPDD191 pKa = 3.26LVDD194 pKa = 5.0FYY196 pKa = 12.01VLAAQWEE203 pKa = 4.4QKK205 pKa = 10.27PFATSFVDD213 pKa = 3.74GTRR216 pKa = 11.84ADD218 pKa = 4.17GNLQLPWTMDD228 pKa = 2.99GYY230 pKa = 11.68NFVINLFAKK239 pKa = 10.6DD240 pKa = 4.35LFSSTNTNTHH250 pKa = 6.21IFNLGTTGLTDD261 pKa = 3.36VYY263 pKa = 10.79DD264 pKa = 3.57GRR266 pKa = 11.84LILRR270 pKa = 11.84QNNSLFQLYY279 pKa = 9.63IDD281 pKa = 4.84PADD284 pKa = 3.94GSASVSSNTSVASNDD299 pKa = 3.46GKK301 pKa = 10.96YY302 pKa = 10.6HH303 pKa = 6.0MLTVLVEE310 pKa = 4.09ATQARR315 pKa = 11.84LYY317 pKa = 10.49IDD319 pKa = 5.51GIYY322 pKa = 8.87KK323 pKa = 7.77TTLTYY328 pKa = 11.18DD329 pKa = 3.5FTKK332 pKa = 10.88EE333 pKa = 4.01NFDD336 pKa = 4.04KK337 pKa = 11.15LVLGSNISFSPVTAYY352 pKa = 10.69GLISNLYY359 pKa = 8.84IGNYY363 pKa = 9.4DD364 pKa = 3.59PNIWTDD370 pKa = 3.28AFIQEE375 pKa = 4.98LYY377 pKa = 8.71NAKK380 pKa = 10.26RR381 pKa = 11.84PFSVPAKK388 pKa = 10.53LPIII392 pKa = 4.4
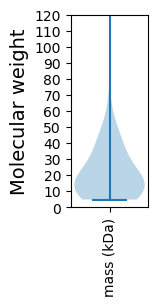
Molecular weight: 43.87 kDa
Isoelectric point according different methods:
Protein with the highest isoelectric point:
>tr|A0A139ZPK3|A0A139ZPK3_9CAUD HTH cro/C1-type domain-containing protein OS=Marinitoga camini virus 1 OX=1629954 GN=UF08_76 PE=4 SV=1
MM1 pKa = 7.55KK2 pKa = 10.44GGDD5 pKa = 3.54IMAKK9 pKa = 7.17TNKK12 pKa = 9.12GKK14 pKa = 10.7KK15 pKa = 8.38IVPVKK20 pKa = 10.69SYY22 pKa = 8.34TRR24 pKa = 11.84KK25 pKa = 10.19KK26 pKa = 9.22NGKK29 pKa = 7.72IEE31 pKa = 3.98KK32 pKa = 9.69VRR34 pKa = 11.84GHH36 pKa = 6.44RR37 pKa = 11.84RR38 pKa = 11.84STPNN42 pKa = 2.98
MM1 pKa = 7.55KK2 pKa = 10.44GGDD5 pKa = 3.54IMAKK9 pKa = 7.17TNKK12 pKa = 9.12GKK14 pKa = 10.7KK15 pKa = 8.38IVPVKK20 pKa = 10.69SYY22 pKa = 8.34TRR24 pKa = 11.84KK25 pKa = 10.19KK26 pKa = 9.22NGKK29 pKa = 7.72IEE31 pKa = 3.98KK32 pKa = 9.69VRR34 pKa = 11.84GHH36 pKa = 6.44RR37 pKa = 11.84RR38 pKa = 11.84STPNN42 pKa = 2.98
Molecular weight: 4.74 kDa
Isoelectric point according different methods:
Peptides (in silico digests for buttom-up proteomics)
Below you can find in silico digests of the whole proteome with Trypsin, Chymotrypsin, Trypsin+LysC, LysN, ArgC proteases suitable for different mass spec machines.| Try ESI |
 |
|---|
| ChTry ESI |
 |
|---|
| ArgC ESI |
 |
|---|
| LysN ESI |
 |
|---|
| TryLysC ESI |
 |
|---|
| Try MALDI |
 |
|---|
| ChTry MALDI |
 |
|---|
| ArgC MALDI |
 |
|---|
| LysN MALDI |
 |
|---|
| TryLysC MALDI |
 |
|---|
| Try LTQ |
 |
|---|
| ChTry LTQ |
 |
|---|
| ArgC LTQ |
 |
|---|
| LysN LTQ |
 |
|---|
| TryLysC LTQ |
 |
|---|
| Try MSlow |
 |
|---|
| ChTry MSlow |
 |
|---|
| ArgC MSlow |
 |
|---|
| LysN MSlow |
 |
|---|
| TryLysC MSlow |
 |
|---|
| Try MShigh |
 |
|---|
| ChTry MShigh |
 |
|---|
| ArgC MShigh |
 |
|---|
| LysN MShigh |
 |
|---|
| TryLysC MShigh |
 |
|---|
General Statistics
Number of major isoforms |
Number of additional isoforms |
Number of all proteins |
Number of amino acids |
Min. Seq. Length |
Max. Seq. Length |
Avg. Seq. Length |
Avg. Mol. Weight |
|---|---|---|---|---|---|---|---|
0 |
15943 |
41 |
1373 |
207.1 |
23.93 |
Amino acid frequency
Ala |
Cys |
Asp |
Glu |
Phe |
Gly |
His |
Ile |
Lys |
Leu |
|---|---|---|---|---|---|---|---|---|---|
4.754 ± 0.417 | 0.452 ± 0.075 |
5.551 ± 0.258 | 8.342 ± 0.454 |
4.88 ± 0.243 | 5.068 ± 0.262 |
1.305 ± 0.135 | 10.287 ± 0.279 |
11.008 ± 0.545 | 8.882 ± 0.265 |
Met |
Asn |
Gln |
Pro |
Arg |
Ser |
Thr |
Val |
Trp |
Tyr |
|---|---|---|---|---|---|---|---|---|---|
2.007 ± 0.117 | 7.138 ± 0.254 |
2.716 ± 0.174 | 3.023 ± 0.246 |
3.318 ± 0.283 | 5.52 ± 0.363 |
5.231 ± 0.423 | 4.93 ± 0.229 |
1.123 ± 0.137 | 4.466 ± 0.225 |
Most of the basic statistics you can see at this page can be downloaded from this CSV file
Proteome-pI is available under Creative Commons Attribution-NoDerivs license, for more details see here
| Reference: Kozlowski LP. Proteome-pI 2.0: Proteome Isoelectric Point Database Update. Nucleic Acids Res. 2021, doi: 10.1093/nar/gkab944 | Contact: Lukasz P. Kozlowski |
