Actinobacteria bacterium
Taxonomy: cellular organisms; Bacteria; Terrabacteria group; Actinobacteria; Actinomycetia; unclassified Actinomycetia
Average proteome isoelectric point is 5.91
Get precalculated fractions of proteins

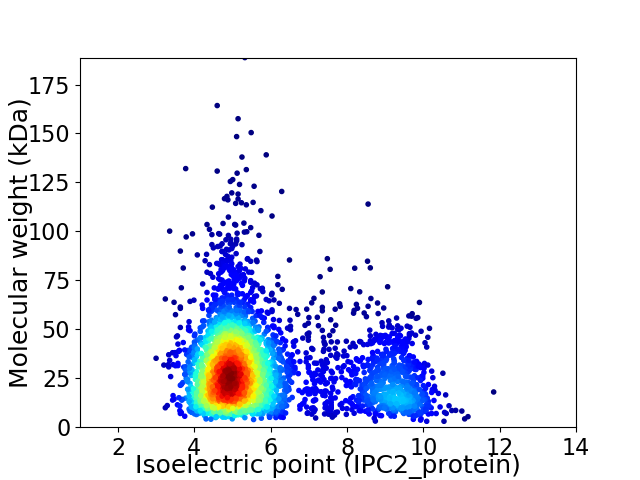
Virtual 2D-PAGE plot for 3711 proteins (isoelectric point calculated using IPC2_protein)
Get csv file with sequences according to given criteria:
* You can choose from 21 different methods for calculating isoelectric point
Summary statistics related to proteome-wise predictions


Protein with the lowest isoelectric point:
>tr|A0A6L5G0D3|A0A6L5G0D3_9ACTN DksA C4-type domain-containing protein OS=Actinobacteria bacterium OX=1883427 GN=GEU71_13755 PE=4 SV=1
MM1 pKa = 7.06ITLFNEE7 pKa = 4.56SSQAEE12 pKa = 4.22PPICADD18 pKa = 4.24GLDD21 pKa = 3.89EE22 pKa = 4.5TQLEE26 pKa = 4.51AIIAQPNDD34 pKa = 3.33YY35 pKa = 10.42YY36 pKa = 11.66LEE38 pKa = 4.52IGNEE42 pKa = 4.0DD43 pKa = 2.83TGGFLKK49 pKa = 10.73SQLWAEE55 pKa = 4.33GDD57 pKa = 3.71APDD60 pKa = 5.29PSEE63 pKa = 4.87GCDD66 pKa = 3.26NSDD69 pKa = 3.08SRR71 pKa = 11.84SYY73 pKa = 11.78GDD75 pKa = 4.51LPIGTWLRR83 pKa = 11.84EE84 pKa = 4.0LLLSEE89 pKa = 5.36GSPQGDD95 pKa = 3.67PLEE98 pKa = 4.81SSDD101 pKa = 3.56IQDD104 pKa = 3.39VGSSLQLKK112 pKa = 9.9GSTSGPPMWMYY123 pKa = 9.31VTAQNPADD131 pKa = 3.79LSKK134 pKa = 11.54DD135 pKa = 3.07EE136 pKa = 4.98GIRR139 pKa = 11.84TEE141 pKa = 4.11HH142 pKa = 6.34VSVIRR147 pKa = 11.84GFEE150 pKa = 3.95ITHH153 pKa = 5.47LTVANGSFDD162 pKa = 3.95GYY164 pKa = 10.7NASNGQWEE172 pKa = 4.45LSIIAYY178 pKa = 9.87GGAEE182 pKa = 4.8GITPKK187 pKa = 10.64LSSDD191 pKa = 3.42QTLDD195 pKa = 3.01WFDD198 pKa = 3.54AALGYY203 pKa = 10.86ADD205 pKa = 4.26TSPPPSCAA213 pKa = 3.3
MM1 pKa = 7.06ITLFNEE7 pKa = 4.56SSQAEE12 pKa = 4.22PPICADD18 pKa = 4.24GLDD21 pKa = 3.89EE22 pKa = 4.5TQLEE26 pKa = 4.51AIIAQPNDD34 pKa = 3.33YY35 pKa = 10.42YY36 pKa = 11.66LEE38 pKa = 4.52IGNEE42 pKa = 4.0DD43 pKa = 2.83TGGFLKK49 pKa = 10.73SQLWAEE55 pKa = 4.33GDD57 pKa = 3.71APDD60 pKa = 5.29PSEE63 pKa = 4.87GCDD66 pKa = 3.26NSDD69 pKa = 3.08SRR71 pKa = 11.84SYY73 pKa = 11.78GDD75 pKa = 4.51LPIGTWLRR83 pKa = 11.84EE84 pKa = 4.0LLLSEE89 pKa = 5.36GSPQGDD95 pKa = 3.67PLEE98 pKa = 4.81SSDD101 pKa = 3.56IQDD104 pKa = 3.39VGSSLQLKK112 pKa = 9.9GSTSGPPMWMYY123 pKa = 9.31VTAQNPADD131 pKa = 3.79LSKK134 pKa = 11.54DD135 pKa = 3.07EE136 pKa = 4.98GIRR139 pKa = 11.84TEE141 pKa = 4.11HH142 pKa = 6.34VSVIRR147 pKa = 11.84GFEE150 pKa = 3.95ITHH153 pKa = 5.47LTVANGSFDD162 pKa = 3.95GYY164 pKa = 10.7NASNGQWEE172 pKa = 4.45LSIIAYY178 pKa = 9.87GGAEE182 pKa = 4.8GITPKK187 pKa = 10.64LSSDD191 pKa = 3.42QTLDD195 pKa = 3.01WFDD198 pKa = 3.54AALGYY203 pKa = 10.86ADD205 pKa = 4.26TSPPPSCAA213 pKa = 3.3
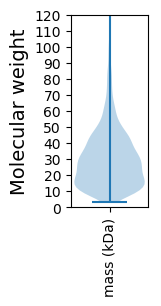
Molecular weight: 22.77 kDa
Isoelectric point according different methods:
Protein with the highest isoelectric point:
>tr|A0A6L5G1D7|A0A6L5G1D7_9ACTN NAD(P)-binding protein OS=Actinobacteria bacterium OX=1883427 GN=GEU71_12515 PE=4 SV=1
MM1 pKa = 7.44GSLVKK6 pKa = 10.25KK7 pKa = 9.81RR8 pKa = 11.84RR9 pKa = 11.84KK10 pKa = 9.63KK11 pKa = 9.26MRR13 pKa = 11.84KK14 pKa = 8.0KK15 pKa = 10.11KK16 pKa = 9.19HH17 pKa = 5.69RR18 pKa = 11.84KK19 pKa = 6.5MLKK22 pKa = 6.94KK23 pKa = 9.13TRR25 pKa = 11.84WQRR28 pKa = 11.84RR29 pKa = 11.84QQGKK33 pKa = 9.75
MM1 pKa = 7.44GSLVKK6 pKa = 10.25KK7 pKa = 9.81RR8 pKa = 11.84RR9 pKa = 11.84KK10 pKa = 9.63KK11 pKa = 9.26MRR13 pKa = 11.84KK14 pKa = 8.0KK15 pKa = 10.11KK16 pKa = 9.19HH17 pKa = 5.69RR18 pKa = 11.84KK19 pKa = 6.5MLKK22 pKa = 6.94KK23 pKa = 9.13TRR25 pKa = 11.84WQRR28 pKa = 11.84RR29 pKa = 11.84QQGKK33 pKa = 9.75
Molecular weight: 4.25 kDa
Isoelectric point according different methods:
Peptides (in silico digests for buttom-up proteomics)
Below you can find in silico digests of the whole proteome with Trypsin, Chymotrypsin, Trypsin+LysC, LysN, ArgC proteases suitable for different mass spec machines.| Try ESI |
 |
|---|
| ChTry ESI |
 |
|---|
| ArgC ESI |
 |
|---|
| LysN ESI |
 |
|---|
| TryLysC ESI |
 |
|---|
| Try MALDI |
 |
|---|
| ChTry MALDI |
 |
|---|
| ArgC MALDI |
 |
|---|
| LysN MALDI |
 |
|---|
| TryLysC MALDI |
 |
|---|
| Try LTQ |
 |
|---|
| ChTry LTQ |
 |
|---|
| ArgC LTQ |
 |
|---|
| LysN LTQ |
 |
|---|
| TryLysC LTQ |
 |
|---|
| Try MSlow |
 |
|---|
| ChTry MSlow |
 |
|---|
| ArgC MSlow |
 |
|---|
| LysN MSlow |
 |
|---|
| TryLysC MSlow |
 |
|---|
| Try MShigh |
 |
|---|
| ChTry MShigh |
 |
|---|
| ArgC MShigh |
 |
|---|
| LysN MShigh |
 |
|---|
| TryLysC MShigh |
 |
|---|
General Statistics
Number of major isoforms |
Number of additional isoforms |
Number of all proteins |
Number of amino acids |
Min. Seq. Length |
Max. Seq. Length |
Avg. Seq. Length |
Avg. Mol. Weight |
|---|---|---|---|---|---|---|---|
0 |
1073929 |
25 |
1737 |
289.4 |
31.35 |
Amino acid frequency
Ala |
Cys |
Asp |
Glu |
Phe |
Gly |
His |
Ile |
Lys |
Leu |
|---|---|---|---|---|---|---|---|---|---|
11.077 ± 0.057 | 0.796 ± 0.013 |
6.251 ± 0.042 | 6.872 ± 0.04 |
3.487 ± 0.028 | 9.233 ± 0.043 |
2.026 ± 0.02 | 5.013 ± 0.023 |
2.961 ± 0.032 | 9.816 ± 0.044 |
Met |
Asn |
Gln |
Pro |
Arg |
Ser |
Thr |
Val |
Trp |
Tyr |
|---|---|---|---|---|---|---|---|---|---|
2.168 ± 0.017 | 2.26 ± 0.022 |
5.252 ± 0.03 | 2.511 ± 0.022 |
7.063 ± 0.049 | 5.857 ± 0.027 |
5.553 ± 0.027 | 8.282 ± 0.03 |
1.358 ± 0.019 | 2.162 ± 0.022 |
Most of the basic statistics you can see at this page can be downloaded from this CSV file
Proteome-pI is available under Creative Commons Attribution-NoDerivs license, for more details see here
| Reference: Kozlowski LP. Proteome-pI 2.0: Proteome Isoelectric Point Database Update. Nucleic Acids Res. 2021, doi: 10.1093/nar/gkab944 | Contact: Lukasz P. Kozlowski |
