Streptomyces phage Fabian
Taxonomy: Viruses; Duplodnaviria; Heunggongvirae; Uroviricota; Caudoviricetes; Caudovirales; Podoviridae; unclassified Podoviridae
Average proteome isoelectric point is 6.11
Get precalculated fractions of proteins

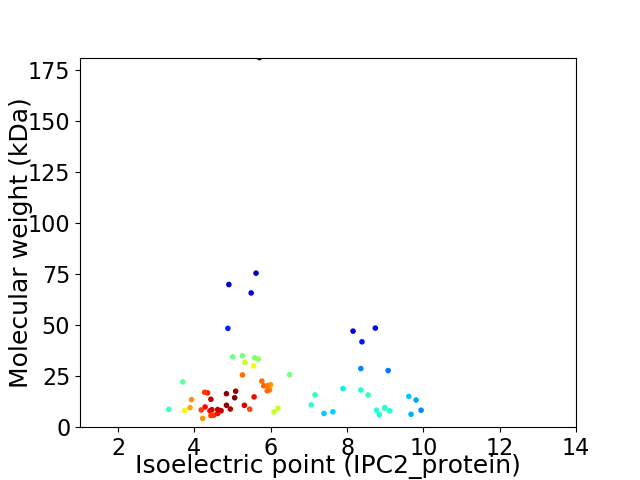
Virtual 2D-PAGE plot for 68 proteins (isoelectric point calculated using IPC2_protein)
Get csv file with sequences according to given criteria:
* You can choose from 21 different methods for calculating isoelectric point
Summary statistics related to proteome-wise predictions


Protein with the lowest isoelectric point:
>tr|A0A5P8D6X5|A0A5P8D6X5_9CAUD Uncharacterized protein OS=Streptomyces phage Fabian OX=2652424 GN=73 PE=4 SV=1
MM1 pKa = 7.2STTISLFVQDD11 pKa = 3.75QDD13 pKa = 4.49GEE15 pKa = 4.36HH16 pKa = 6.26TEE18 pKa = 4.0IDD20 pKa = 4.6LDD22 pKa = 4.29DD23 pKa = 3.57VWIQSDD29 pKa = 4.23VIDD32 pKa = 3.96EE33 pKa = 4.37EE34 pKa = 4.78SFHH37 pKa = 6.34GALVAKK43 pKa = 9.91IATWALEE50 pKa = 4.16RR51 pKa = 11.84GSSFDD56 pKa = 5.03DD57 pKa = 3.35ISGLTVDD64 pKa = 5.04DD65 pKa = 5.74DD66 pKa = 4.17EE67 pKa = 4.95GQEE70 pKa = 4.3LEE72 pKa = 4.03IHH74 pKa = 6.31NEE76 pKa = 3.81TGEE79 pKa = 4.13NRR81 pKa = 11.84HH82 pKa = 4.77SWILEE87 pKa = 4.01VVQLYY92 pKa = 8.14MWLNCDD98 pKa = 2.66KK99 pKa = 10.67HH100 pKa = 7.3YY101 pKa = 11.44CEE103 pKa = 5.9DD104 pKa = 3.6EE105 pKa = 5.22AILARR110 pKa = 11.84VDD112 pKa = 3.95DD113 pKa = 5.27IGWKK117 pKa = 9.56WFDD120 pKa = 3.85FDD122 pKa = 6.0SDD124 pKa = 3.8LQEE127 pKa = 5.76AEE129 pKa = 4.62DD130 pKa = 4.33MYY132 pKa = 11.46SQEE135 pKa = 3.9FDD137 pKa = 3.03GDD139 pKa = 3.67YY140 pKa = 11.33AEE142 pKa = 4.46YY143 pKa = 10.62ARR145 pKa = 11.84EE146 pKa = 3.92YY147 pKa = 10.32MDD149 pKa = 3.9GCGEE153 pKa = 4.27SLSEE157 pKa = 3.78WAEE160 pKa = 3.91KK161 pKa = 10.58YY162 pKa = 10.28FDD164 pKa = 3.75YY165 pKa = 11.33EE166 pKa = 4.22EE167 pKa = 4.52YY168 pKa = 11.31GEE170 pKa = 4.8DD171 pKa = 4.73LVDD174 pKa = 4.55GYY176 pKa = 11.61DD177 pKa = 3.31RR178 pKa = 11.84VSWGSRR184 pKa = 11.84EE185 pKa = 3.92FLFSQQ190 pKa = 4.23
MM1 pKa = 7.2STTISLFVQDD11 pKa = 3.75QDD13 pKa = 4.49GEE15 pKa = 4.36HH16 pKa = 6.26TEE18 pKa = 4.0IDD20 pKa = 4.6LDD22 pKa = 4.29DD23 pKa = 3.57VWIQSDD29 pKa = 4.23VIDD32 pKa = 3.96EE33 pKa = 4.37EE34 pKa = 4.78SFHH37 pKa = 6.34GALVAKK43 pKa = 9.91IATWALEE50 pKa = 4.16RR51 pKa = 11.84GSSFDD56 pKa = 5.03DD57 pKa = 3.35ISGLTVDD64 pKa = 5.04DD65 pKa = 5.74DD66 pKa = 4.17EE67 pKa = 4.95GQEE70 pKa = 4.3LEE72 pKa = 4.03IHH74 pKa = 6.31NEE76 pKa = 3.81TGEE79 pKa = 4.13NRR81 pKa = 11.84HH82 pKa = 4.77SWILEE87 pKa = 4.01VVQLYY92 pKa = 8.14MWLNCDD98 pKa = 2.66KK99 pKa = 10.67HH100 pKa = 7.3YY101 pKa = 11.44CEE103 pKa = 5.9DD104 pKa = 3.6EE105 pKa = 5.22AILARR110 pKa = 11.84VDD112 pKa = 3.95DD113 pKa = 5.27IGWKK117 pKa = 9.56WFDD120 pKa = 3.85FDD122 pKa = 6.0SDD124 pKa = 3.8LQEE127 pKa = 5.76AEE129 pKa = 4.62DD130 pKa = 4.33MYY132 pKa = 11.46SQEE135 pKa = 3.9FDD137 pKa = 3.03GDD139 pKa = 3.67YY140 pKa = 11.33AEE142 pKa = 4.46YY143 pKa = 10.62ARR145 pKa = 11.84EE146 pKa = 3.92YY147 pKa = 10.32MDD149 pKa = 3.9GCGEE153 pKa = 4.27SLSEE157 pKa = 3.78WAEE160 pKa = 3.91KK161 pKa = 10.58YY162 pKa = 10.28FDD164 pKa = 3.75YY165 pKa = 11.33EE166 pKa = 4.22EE167 pKa = 4.52YY168 pKa = 11.31GEE170 pKa = 4.8DD171 pKa = 4.73LVDD174 pKa = 4.55GYY176 pKa = 11.61DD177 pKa = 3.31RR178 pKa = 11.84VSWGSRR184 pKa = 11.84EE185 pKa = 3.92FLFSQQ190 pKa = 4.23
Molecular weight: 22.21 kDa
Isoelectric point according different methods:
Protein with the highest isoelectric point:
>tr|A0A5P8D6X2|A0A5P8D6X2_9CAUD Uncharacterized protein OS=Streptomyces phage Fabian OX=2652424 GN=37 PE=4 SV=1
MM1 pKa = 7.48IAFDD5 pKa = 4.23EE6 pKa = 4.7TFMSAGDD13 pKa = 3.67PMVTTRR19 pKa = 11.84IPGFGSGNRR28 pKa = 11.84TPQTSRR34 pKa = 11.84VHH36 pKa = 5.36VSRR39 pKa = 11.84AKK41 pKa = 10.33GVKK44 pKa = 8.97QGKK47 pKa = 8.36PVTKK51 pKa = 10.12GLARR55 pKa = 11.84SAVAVVRR62 pKa = 11.84VNPRR66 pKa = 11.84KK67 pKa = 9.95FEE69 pKa = 3.79IRR71 pKa = 11.84VKK73 pKa = 10.7GSRR76 pKa = 11.84ALLGFVTKK84 pKa = 10.75VKK86 pKa = 10.57GAGGKK91 pKa = 9.93AYY93 pKa = 9.82AYY95 pKa = 10.29QCLLPNTDD103 pKa = 3.44AKK105 pKa = 9.4VHH107 pKa = 6.34KK108 pKa = 10.57GFATQKK114 pKa = 8.84EE115 pKa = 4.44AVARR119 pKa = 11.84MLEE122 pKa = 4.12KK123 pKa = 10.82CC124 pKa = 4.05
MM1 pKa = 7.48IAFDD5 pKa = 4.23EE6 pKa = 4.7TFMSAGDD13 pKa = 3.67PMVTTRR19 pKa = 11.84IPGFGSGNRR28 pKa = 11.84TPQTSRR34 pKa = 11.84VHH36 pKa = 5.36VSRR39 pKa = 11.84AKK41 pKa = 10.33GVKK44 pKa = 8.97QGKK47 pKa = 8.36PVTKK51 pKa = 10.12GLARR55 pKa = 11.84SAVAVVRR62 pKa = 11.84VNPRR66 pKa = 11.84KK67 pKa = 9.95FEE69 pKa = 3.79IRR71 pKa = 11.84VKK73 pKa = 10.7GSRR76 pKa = 11.84ALLGFVTKK84 pKa = 10.75VKK86 pKa = 10.57GAGGKK91 pKa = 9.93AYY93 pKa = 9.82AYY95 pKa = 10.29QCLLPNTDD103 pKa = 3.44AKK105 pKa = 9.4VHH107 pKa = 6.34KK108 pKa = 10.57GFATQKK114 pKa = 8.84EE115 pKa = 4.44AVARR119 pKa = 11.84MLEE122 pKa = 4.12KK123 pKa = 10.82CC124 pKa = 4.05
Molecular weight: 13.34 kDa
Isoelectric point according different methods:
Peptides (in silico digests for buttom-up proteomics)
Below you can find in silico digests of the whole proteome with Trypsin, Chymotrypsin, Trypsin+LysC, LysN, ArgC proteases suitable for different mass spec machines.| Try ESI |
 |
|---|
| ChTry ESI |
 |
|---|
| ArgC ESI |
 |
|---|
| LysN ESI |
 |
|---|
| TryLysC ESI |
 |
|---|
| Try MALDI |
 |
|---|
| ChTry MALDI |
 |
|---|
| ArgC MALDI |
 |
|---|
| LysN MALDI |
 |
|---|
| TryLysC MALDI |
 |
|---|
| Try LTQ |
 |
|---|
| ChTry LTQ |
 |
|---|
| ArgC LTQ |
 |
|---|
| LysN LTQ |
 |
|---|
| TryLysC LTQ |
 |
|---|
| Try MSlow |
 |
|---|
| ChTry MSlow |
 |
|---|
| ArgC MSlow |
 |
|---|
| LysN MSlow |
 |
|---|
| TryLysC MSlow |
 |
|---|
| Try MShigh |
 |
|---|
| ChTry MShigh |
 |
|---|
| ArgC MShigh |
 |
|---|
| LysN MShigh |
 |
|---|
| TryLysC MShigh |
 |
|---|
General Statistics
Number of major isoforms |
Number of additional isoforms |
Number of all proteins |
Number of amino acids |
Min. Seq. Length |
Max. Seq. Length |
Avg. Seq. Length |
Avg. Mol. Weight |
|---|---|---|---|---|---|---|---|
0 |
13536 |
40 |
1635 |
199.1 |
21.86 |
Amino acid frequency
Ala |
Cys |
Asp |
Glu |
Phe |
Gly |
His |
Ile |
Lys |
Leu |
|---|---|---|---|---|---|---|---|---|---|
10.033 ± 0.378 | 0.79 ± 0.179 |
6.546 ± 0.317 | 5.578 ± 0.367 |
3.125 ± 0.178 | 8.518 ± 0.363 |
1.581 ± 0.16 | 4.189 ± 0.224 |
5.725 ± 0.404 | 7.388 ± 0.229 |
Met |
Asn |
Gln |
Pro |
Arg |
Ser |
Thr |
Val |
Trp |
Tyr |
|---|---|---|---|---|---|---|---|---|---|
2.726 ± 0.201 | 4.13 ± 0.256 |
4.418 ± 0.264 | 4.41 ± 0.317 |
5.001 ± 0.287 | 6.316 ± 0.306 |
6.944 ± 0.469 | 7.018 ± 0.325 |
1.729 ± 0.138 | 3.834 ± 0.238 |
Most of the basic statistics you can see at this page can be downloaded from this CSV file
Proteome-pI is available under Creative Commons Attribution-NoDerivs license, for more details see here
| Reference: Kozlowski LP. Proteome-pI 2.0: Proteome Isoelectric Point Database Update. Nucleic Acids Res. 2021, doi: 10.1093/nar/gkab944 | Contact: Lukasz P. Kozlowski |
