Mycolicibacterium fortuitum (Mycobacterium fortuitum)
Taxonomy: cellular organisms; Bacteria; Terrabacteria group; Actinobacteria; Actinomycetia; Corynebacteriales; Mycobacteriaceae; Mycolicibacterium
Average proteome isoelectric point is 5.96
Get precalculated fractions of proteins

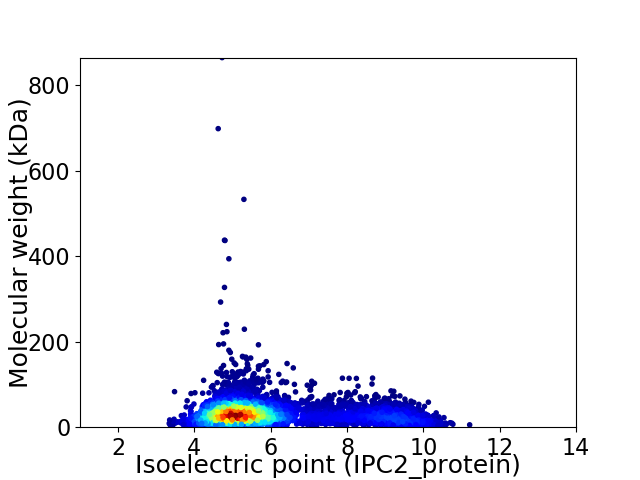
Virtual 2D-PAGE plot for 6012 proteins (isoelectric point calculated using IPC2_protein)
Get csv file with sequences according to given criteria:
* You can choose from 21 different methods for calculating isoelectric point
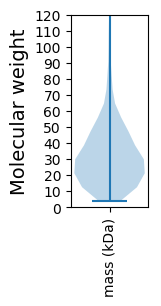
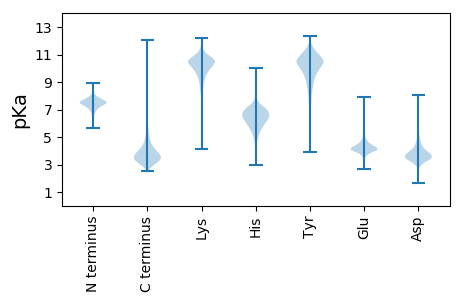
Summary statistics related to proteome-wise predictions


Protein with the lowest isoelectric point:
>tr|A0A0N9Y3C8|A0A0N9Y3C8_MYCFO Uncharacterized protein OS=Mycolicibacterium fortuitum OX=1766 GN=A5751_32160 PE=4 SV=1
MM1 pKa = 7.57SGPNPPEE8 pKa = 4.52PGASGSDD15 pKa = 4.04LPDD18 pKa = 3.13QPGKK22 pKa = 10.17HH23 pKa = 5.96SAPEE27 pKa = 3.92EE28 pKa = 3.97PTQVSGTDD36 pKa = 3.16ADD38 pKa = 4.59GEE40 pKa = 4.86TEE42 pKa = 4.88FYY44 pKa = 10.29SQAYY48 pKa = 8.25SAPEE52 pKa = 3.93SEE54 pKa = 4.76QFTSGPYY61 pKa = 9.8VPADD65 pKa = 3.42VALYY69 pKa = 10.36DD70 pKa = 3.9YY71 pKa = 11.36DD72 pKa = 6.19DD73 pKa = 4.74YY74 pKa = 12.13DD75 pKa = 3.91PATEE79 pKa = 4.65LVDD82 pKa = 3.66TAPPPRR88 pKa = 11.84WPWVVGITAIIAAVALVASVAVLVTRR114 pKa = 11.84DD115 pKa = 3.35EE116 pKa = 4.41DD117 pKa = 4.09TTNLATPHH125 pKa = 7.03PSTTTSLPPVQDD137 pKa = 4.56EE138 pKa = 4.58ITTTTPPPPPPTSEE152 pKa = 4.35EE153 pKa = 4.28LPPPPPPEE161 pKa = 4.0TVTVTEE167 pKa = 4.82PPPPAPAPTSEE178 pKa = 4.81APPPAPSTTSAPPTTTTTHH197 pKa = 6.57AGPRR201 pKa = 11.84QVTYY205 pKa = 11.02SVTGTKK211 pKa = 10.45APGDD215 pKa = 4.39IITITYY221 pKa = 10.34VDD223 pKa = 3.55GNGNRR228 pKa = 11.84RR229 pKa = 11.84TLRR232 pKa = 11.84NVYY235 pKa = 9.98IPWTFTMTPISNSDD249 pKa = 3.4VGSVEE254 pKa = 3.81ASSLFLVSRR263 pKa = 11.84LNCSITASDD272 pKa = 3.87GTVLSSNANNSAQTACC288 pKa = 4.32
MM1 pKa = 7.57SGPNPPEE8 pKa = 4.52PGASGSDD15 pKa = 4.04LPDD18 pKa = 3.13QPGKK22 pKa = 10.17HH23 pKa = 5.96SAPEE27 pKa = 3.92EE28 pKa = 3.97PTQVSGTDD36 pKa = 3.16ADD38 pKa = 4.59GEE40 pKa = 4.86TEE42 pKa = 4.88FYY44 pKa = 10.29SQAYY48 pKa = 8.25SAPEE52 pKa = 3.93SEE54 pKa = 4.76QFTSGPYY61 pKa = 9.8VPADD65 pKa = 3.42VALYY69 pKa = 10.36DD70 pKa = 3.9YY71 pKa = 11.36DD72 pKa = 6.19DD73 pKa = 4.74YY74 pKa = 12.13DD75 pKa = 3.91PATEE79 pKa = 4.65LVDD82 pKa = 3.66TAPPPRR88 pKa = 11.84WPWVVGITAIIAAVALVASVAVLVTRR114 pKa = 11.84DD115 pKa = 3.35EE116 pKa = 4.41DD117 pKa = 4.09TTNLATPHH125 pKa = 7.03PSTTTSLPPVQDD137 pKa = 4.56EE138 pKa = 4.58ITTTTPPPPPPTSEE152 pKa = 4.35EE153 pKa = 4.28LPPPPPPEE161 pKa = 4.0TVTVTEE167 pKa = 4.82PPPPAPAPTSEE178 pKa = 4.81APPPAPSTTSAPPTTTTTHH197 pKa = 6.57AGPRR201 pKa = 11.84QVTYY205 pKa = 11.02SVTGTKK211 pKa = 10.45APGDD215 pKa = 4.39IITITYY221 pKa = 10.34VDD223 pKa = 3.55GNGNRR228 pKa = 11.84RR229 pKa = 11.84TLRR232 pKa = 11.84NVYY235 pKa = 9.98IPWTFTMTPISNSDD249 pKa = 3.4VGSVEE254 pKa = 3.81ASSLFLVSRR263 pKa = 11.84LNCSITASDD272 pKa = 3.87GTVLSSNANNSAQTACC288 pKa = 4.32
Molecular weight: 29.9 kDa
Isoelectric point according different methods:
Protein with the highest isoelectric point:
>tr|A0A0N9YKT1|A0A0N9YKT1_MYCFO ATP-dependent DNA helicase OS=Mycolicibacterium fortuitum OX=1766 GN=pcrA PE=3 SV=1
MM1 pKa = 7.63AKK3 pKa = 10.11GKK5 pKa = 8.48RR6 pKa = 11.84TYY8 pKa = 10.27QPNNRR13 pKa = 11.84RR14 pKa = 11.84RR15 pKa = 11.84ARR17 pKa = 11.84VHH19 pKa = 5.99GFRR22 pKa = 11.84LRR24 pKa = 11.84MRR26 pKa = 11.84TRR28 pKa = 11.84AGRR31 pKa = 11.84AIVANRR37 pKa = 11.84RR38 pKa = 11.84SKK40 pKa = 10.67GRR42 pKa = 11.84RR43 pKa = 11.84ALTAA47 pKa = 3.88
MM1 pKa = 7.63AKK3 pKa = 10.11GKK5 pKa = 8.48RR6 pKa = 11.84TYY8 pKa = 10.27QPNNRR13 pKa = 11.84RR14 pKa = 11.84RR15 pKa = 11.84ARR17 pKa = 11.84VHH19 pKa = 5.99GFRR22 pKa = 11.84LRR24 pKa = 11.84MRR26 pKa = 11.84TRR28 pKa = 11.84AGRR31 pKa = 11.84AIVANRR37 pKa = 11.84RR38 pKa = 11.84SKK40 pKa = 10.67GRR42 pKa = 11.84RR43 pKa = 11.84ALTAA47 pKa = 3.88
Molecular weight: 5.52 kDa
Isoelectric point according different methods:
Peptides (in silico digests for buttom-up proteomics)
Below you can find in silico digests of the whole proteome with Trypsin, Chymotrypsin, Trypsin+LysC, LysN, ArgC proteases suitable for different mass spec machines.| Try ESI |
 |
|---|
| ChTry ESI |
 |
|---|
| ArgC ESI |
 |
|---|
| LysN ESI |
 |
|---|
| TryLysC ESI |
 |
|---|
| Try MALDI |
 |
|---|
| ChTry MALDI |
 |
|---|
| ArgC MALDI |
 |
|---|
| LysN MALDI |
 |
|---|
| TryLysC MALDI |
 |
|---|
| Try LTQ |
 |
|---|
| ChTry LTQ |
 |
|---|
| ArgC LTQ |
 |
|---|
| LysN LTQ |
 |
|---|
| TryLysC LTQ |
 |
|---|
| Try MSlow |
 |
|---|
| ChTry MSlow |
 |
|---|
| ArgC MSlow |
 |
|---|
| LysN MSlow |
 |
|---|
| TryLysC MSlow |
 |
|---|
| Try MShigh |
 |
|---|
| ChTry MShigh |
 |
|---|
| ArgC MShigh |
 |
|---|
| LysN MShigh |
 |
|---|
| TryLysC MShigh |
 |
|---|
General Statistics
Number of major isoforms |
Number of additional isoforms |
Number of all proteins |
Number of amino acids |
Min. Seq. Length |
Max. Seq. Length |
Avg. Seq. Length |
Avg. Mol. Weight |
|---|---|---|---|---|---|---|---|
0 |
1901592 |
37 |
8102 |
316.3 |
33.97 |
Amino acid frequency
Ala |
Cys |
Asp |
Glu |
Phe |
Gly |
His |
Ile |
Lys |
Leu |
|---|---|---|---|---|---|---|---|---|---|
12.951 ± 0.039 | 0.784 ± 0.009 |
6.275 ± 0.024 | 5.339 ± 0.026 |
3.076 ± 0.016 | 8.812 ± 0.03 |
2.192 ± 0.014 | 4.31 ± 0.024 |
2.302 ± 0.022 | 9.814 ± 0.031 |
Met |
Asn |
Gln |
Pro |
Arg |
Ser |
Thr |
Val |
Trp |
Tyr |
|---|---|---|---|---|---|---|---|---|---|
2.106 ± 0.015 | 2.284 ± 0.017 |
5.804 ± 0.028 | 3.084 ± 0.019 |
6.976 ± 0.029 | 5.466 ± 0.016 |
6.076 ± 0.023 | 8.645 ± 0.03 |
1.525 ± 0.015 | 2.177 ± 0.015 |
Most of the basic statistics you can see at this page can be downloaded from this CSV file
Proteome-pI is available under Creative Commons Attribution-NoDerivs license, for more details see here
| Reference: Kozlowski LP. Proteome-pI 2.0: Proteome Isoelectric Point Database Update. Nucleic Acids Res. 2021, doi: 10.1093/nar/gkab944 | Contact: Lukasz P. Kozlowski |
