Comamonas serinivorans
Taxonomy: cellular organisms; Bacteria; Proteobacteria; Betaproteobacteria; Burkholderiales; Comamonadaceae; Comamonas
Average proteome isoelectric point is 6.9
Get precalculated fractions of proteins

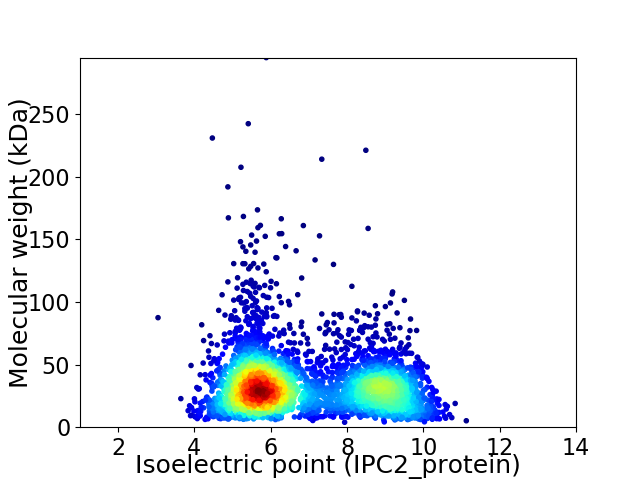
Virtual 2D-PAGE plot for 3699 proteins (isoelectric point calculated using IPC2_protein)
Get csv file with sequences according to given criteria:
* You can choose from 21 different methods for calculating isoelectric point
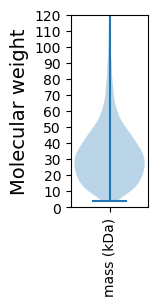
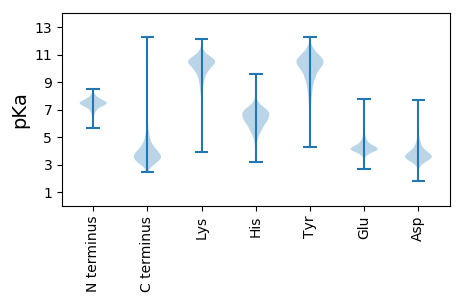
Summary statistics related to proteome-wise predictions


Protein with the lowest isoelectric point:
>tr|A0A1Y0EP99|A0A1Y0EP99_9BURK Cytochrome C OS=Comamonas serinivorans OX=1082851 GN=CCO03_11000 PE=4 SV=1
MM1 pKa = 7.5QILFPNSFGHH11 pKa = 6.97PLPQEE16 pKa = 4.61DD17 pKa = 4.43EE18 pKa = 4.36VLDD21 pKa = 3.96LQEE24 pKa = 4.51QYY26 pKa = 11.54GFSQDD31 pKa = 3.25YY32 pKa = 11.43AEE34 pKa = 5.37FLFRR38 pKa = 11.84QNGFSFDD45 pKa = 3.79RR46 pKa = 11.84LADD49 pKa = 3.63ASDD52 pKa = 4.07PDD54 pKa = 3.25EE55 pKa = 4.54CLAVGEE61 pKa = 5.07DD62 pKa = 3.96DD63 pKa = 5.32AEE65 pKa = 4.48GNADD69 pKa = 4.02LRR71 pKa = 11.84HH72 pKa = 6.23LYY74 pKa = 10.77ALGAEE79 pKa = 4.5APFDD83 pKa = 4.09DD84 pKa = 6.22LNAQLEE90 pKa = 4.34DD91 pKa = 4.48FIFRR95 pKa = 11.84EE96 pKa = 4.09VLFPIGAGYY105 pKa = 9.87GGQVFVEE112 pKa = 4.32VLAGKK117 pKa = 9.25YY118 pKa = 8.81QGFIASLDD126 pKa = 3.7HH127 pKa = 6.86EE128 pKa = 5.27LYY130 pKa = 10.88ASNTSLEE137 pKa = 4.29EE138 pKa = 3.96YY139 pKa = 10.7LEE141 pKa = 4.16EE142 pKa = 6.17AEE144 pKa = 5.03LEE146 pKa = 4.19GSEE149 pKa = 4.3EE150 pKa = 4.64DD151 pKa = 4.25RR152 pKa = 11.84DD153 pKa = 3.98ALADD157 pKa = 3.82ALCDD161 pKa = 4.06PEE163 pKa = 6.44SGLAWFHH170 pKa = 6.25ARR172 pKa = 11.84SLRR175 pKa = 11.84QFLSEE180 pKa = 5.22CVFCDD185 pKa = 3.38EE186 pKa = 4.59SLTGFVMDD194 pKa = 5.92ADD196 pKa = 4.43DD197 pKa = 6.69LPDD200 pKa = 3.58EE201 pKa = 4.7LLNN204 pKa = 4.27
MM1 pKa = 7.5QILFPNSFGHH11 pKa = 6.97PLPQEE16 pKa = 4.61DD17 pKa = 4.43EE18 pKa = 4.36VLDD21 pKa = 3.96LQEE24 pKa = 4.51QYY26 pKa = 11.54GFSQDD31 pKa = 3.25YY32 pKa = 11.43AEE34 pKa = 5.37FLFRR38 pKa = 11.84QNGFSFDD45 pKa = 3.79RR46 pKa = 11.84LADD49 pKa = 3.63ASDD52 pKa = 4.07PDD54 pKa = 3.25EE55 pKa = 4.54CLAVGEE61 pKa = 5.07DD62 pKa = 3.96DD63 pKa = 5.32AEE65 pKa = 4.48GNADD69 pKa = 4.02LRR71 pKa = 11.84HH72 pKa = 6.23LYY74 pKa = 10.77ALGAEE79 pKa = 4.5APFDD83 pKa = 4.09DD84 pKa = 6.22LNAQLEE90 pKa = 4.34DD91 pKa = 4.48FIFRR95 pKa = 11.84EE96 pKa = 4.09VLFPIGAGYY105 pKa = 9.87GGQVFVEE112 pKa = 4.32VLAGKK117 pKa = 9.25YY118 pKa = 8.81QGFIASLDD126 pKa = 3.7HH127 pKa = 6.86EE128 pKa = 5.27LYY130 pKa = 10.88ASNTSLEE137 pKa = 4.29EE138 pKa = 3.96YY139 pKa = 10.7LEE141 pKa = 4.16EE142 pKa = 6.17AEE144 pKa = 5.03LEE146 pKa = 4.19GSEE149 pKa = 4.3EE150 pKa = 4.64DD151 pKa = 4.25RR152 pKa = 11.84DD153 pKa = 3.98ALADD157 pKa = 3.82ALCDD161 pKa = 4.06PEE163 pKa = 6.44SGLAWFHH170 pKa = 6.25ARR172 pKa = 11.84SLRR175 pKa = 11.84QFLSEE180 pKa = 5.22CVFCDD185 pKa = 3.38EE186 pKa = 4.59SLTGFVMDD194 pKa = 5.92ADD196 pKa = 4.43DD197 pKa = 6.69LPDD200 pKa = 3.58EE201 pKa = 4.7LLNN204 pKa = 4.27
Molecular weight: 22.79 kDa
Isoelectric point according different methods:
Protein with the highest isoelectric point:
>tr|A0A1Y0ES83|A0A1Y0ES83_9BURK Probable GTP-binding protein EngB OS=Comamonas serinivorans OX=1082851 GN=engB PE=3 SV=1
MM1 pKa = 7.35KK2 pKa = 9.43RR3 pKa = 11.84TYY5 pKa = 10.25QPSKK9 pKa = 7.79TRR11 pKa = 11.84RR12 pKa = 11.84ARR14 pKa = 11.84THH16 pKa = 5.79GFLVRR21 pKa = 11.84MKK23 pKa = 9.7TRR25 pKa = 11.84GGRR28 pKa = 11.84AVINARR34 pKa = 11.84RR35 pKa = 11.84AKK37 pKa = 9.58GRR39 pKa = 11.84KK40 pKa = 8.75RR41 pKa = 11.84LAVV44 pKa = 3.41
MM1 pKa = 7.35KK2 pKa = 9.43RR3 pKa = 11.84TYY5 pKa = 10.25QPSKK9 pKa = 7.79TRR11 pKa = 11.84RR12 pKa = 11.84ARR14 pKa = 11.84THH16 pKa = 5.79GFLVRR21 pKa = 11.84MKK23 pKa = 9.7TRR25 pKa = 11.84GGRR28 pKa = 11.84AVINARR34 pKa = 11.84RR35 pKa = 11.84AKK37 pKa = 9.58GRR39 pKa = 11.84KK40 pKa = 8.75RR41 pKa = 11.84LAVV44 pKa = 3.41
Molecular weight: 5.14 kDa
Isoelectric point according different methods:
Peptides (in silico digests for buttom-up proteomics)
Below you can find in silico digests of the whole proteome with Trypsin, Chymotrypsin, Trypsin+LysC, LysN, ArgC proteases suitable for different mass spec machines.| Try ESI |
 |
|---|
| ChTry ESI |
 |
|---|
| ArgC ESI |
 |
|---|
| LysN ESI |
 |
|---|
| TryLysC ESI |
 |
|---|
| Try MALDI |
 |
|---|
| ChTry MALDI |
 |
|---|
| ArgC MALDI |
 |
|---|
| LysN MALDI |
 |
|---|
| TryLysC MALDI |
 |
|---|
| Try LTQ |
 |
|---|
| ChTry LTQ |
 |
|---|
| ArgC LTQ |
 |
|---|
| LysN LTQ |
 |
|---|
| TryLysC LTQ |
 |
|---|
| Try MSlow |
 |
|---|
| ChTry MSlow |
 |
|---|
| ArgC MSlow |
 |
|---|
| LysN MSlow |
 |
|---|
| TryLysC MSlow |
 |
|---|
| Try MShigh |
 |
|---|
| ChTry MShigh |
 |
|---|
| ArgC MShigh |
 |
|---|
| LysN MShigh |
 |
|---|
| TryLysC MShigh |
 |
|---|
General Statistics
Number of major isoforms |
Number of additional isoforms |
Number of all proteins |
Number of amino acids |
Min. Seq. Length |
Max. Seq. Length |
Avg. Seq. Length |
Avg. Mol. Weight |
|---|---|---|---|---|---|---|---|
0 |
1213414 |
34 |
2774 |
328.0 |
35.38 |
Amino acid frequency
Ala |
Cys |
Asp |
Glu |
Phe |
Gly |
His |
Ile |
Lys |
Leu |
|---|---|---|---|---|---|---|---|---|---|
13.774 ± 0.06 | 0.926 ± 0.012 |
5.236 ± 0.03 | 4.745 ± 0.036 |
3.197 ± 0.024 | 8.409 ± 0.045 |
2.413 ± 0.023 | 3.752 ± 0.032 |
2.838 ± 0.037 | 10.861 ± 0.05 |
Met |
Asn |
Gln |
Pro |
Arg |
Ser |
Thr |
Val |
Trp |
Tyr |
|---|---|---|---|---|---|---|---|---|---|
2.364 ± 0.02 | 2.438 ± 0.024 |
5.718 ± 0.035 | 4.66 ± 0.029 |
6.823 ± 0.041 | 5.137 ± 0.031 |
5.295 ± 0.033 | 7.768 ± 0.035 |
1.625 ± 0.02 | 2.021 ± 0.018 |
Most of the basic statistics you can see at this page can be downloaded from this CSV file
Proteome-pI is available under Creative Commons Attribution-NoDerivs license, for more details see here
| Reference: Kozlowski LP. Proteome-pI 2.0: Proteome Isoelectric Point Database Update. Nucleic Acids Res. 2021, doi: 10.1093/nar/gkab944 | Contact: Lukasz P. Kozlowski |
