Sphingomonas sp. L-1-4w-11
Taxonomy: cellular organisms; Bacteria; Proteobacteria; Alphaproteobacteria; Sphingomonadales; Sphingomonadaceae; Sphingomonas; unclassified Sphingomonas
Average proteome isoelectric point is 6.58
Get precalculated fractions of proteins

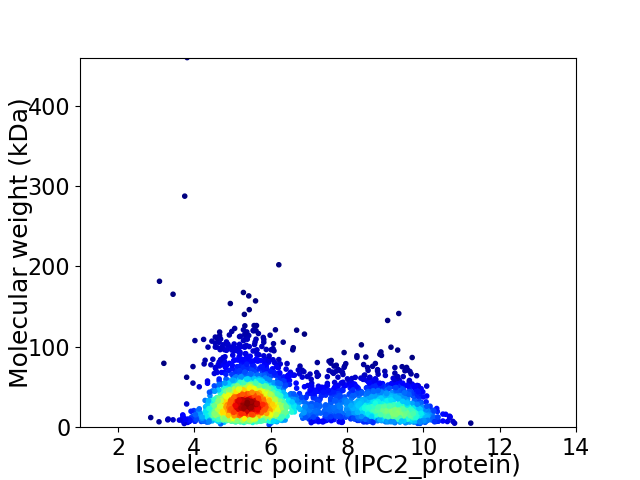
Virtual 2D-PAGE plot for 3108 proteins (isoelectric point calculated using IPC2_protein)
Get csv file with sequences according to given criteria:
* You can choose from 21 different methods for calculating isoelectric point
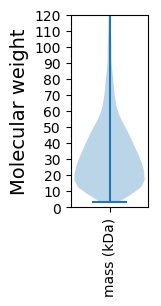
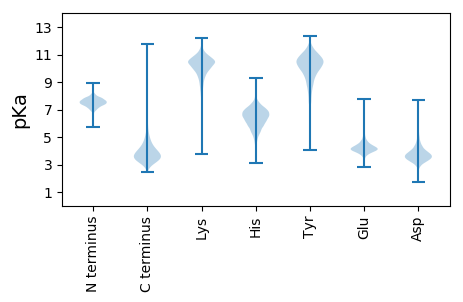
Summary statistics related to proteome-wise predictions


Protein with the lowest isoelectric point:
>tr|A0A4U1L2D7|A0A4U1L2D7_9SPHN 2-polyprenylphenol 6-hydroxylase OS=Sphingomonas sp. L-1-4w-11 OX=2572576 GN=ubiB PE=4 SV=1
MM1 pKa = 7.66RR2 pKa = 11.84FSTPSLAALSLMLFAAPAYY21 pKa = 9.39AQEE24 pKa = 4.31EE25 pKa = 4.46TAPPEE30 pKa = 4.22PLTVTGSVTLASDD43 pKa = 3.34YY44 pKa = 10.82RR45 pKa = 11.84FRR47 pKa = 11.84GVSQTDD53 pKa = 3.26KK54 pKa = 11.04EE55 pKa = 4.23FAIQGGATIAHH66 pKa = 6.66EE67 pKa = 4.45SGVYY71 pKa = 10.21AGFWGSNLAGWGTFGGANMEE91 pKa = 4.02LDD93 pKa = 3.11IYY95 pKa = 11.17GGFKK99 pKa = 10.65FPVGDD104 pKa = 4.29GGTLDD109 pKa = 5.14VGVTWYY115 pKa = 8.57MYY117 pKa = 10.39PGGADD122 pKa = 3.12VTDD125 pKa = 3.98FAEE128 pKa = 5.02PYY130 pKa = 10.14VKK132 pKa = 10.67LSGTAGPVSLTAGVFYY148 pKa = 10.72APKK151 pKa = 10.16QEE153 pKa = 4.07ALGDD157 pKa = 3.85VFFTGAAAASGIPDD171 pKa = 4.22DD172 pKa = 5.5PGDD175 pKa = 4.36SEE177 pKa = 5.69DD178 pKa = 3.93NLYY181 pKa = 11.18LSGDD185 pKa = 3.49AVFAIPEE192 pKa = 4.48TPVSLRR198 pKa = 11.84GHH200 pKa = 6.71IGYY203 pKa = 9.99SDD205 pKa = 4.0GNPGLGPNGTSVAPTGQYY223 pKa = 9.57WDD225 pKa = 3.71WNLGADD231 pKa = 3.8VSVLGLTLGVSYY243 pKa = 10.94IDD245 pKa = 3.83TDD247 pKa = 3.28ISAADD252 pKa = 3.76GAYY255 pKa = 10.77LLPNFQKK262 pKa = 8.08TTGGSIADD270 pKa = 3.66GTIVVSLTAAFF281 pKa = 3.94
MM1 pKa = 7.66RR2 pKa = 11.84FSTPSLAALSLMLFAAPAYY21 pKa = 9.39AQEE24 pKa = 4.31EE25 pKa = 4.46TAPPEE30 pKa = 4.22PLTVTGSVTLASDD43 pKa = 3.34YY44 pKa = 10.82RR45 pKa = 11.84FRR47 pKa = 11.84GVSQTDD53 pKa = 3.26KK54 pKa = 11.04EE55 pKa = 4.23FAIQGGATIAHH66 pKa = 6.66EE67 pKa = 4.45SGVYY71 pKa = 10.21AGFWGSNLAGWGTFGGANMEE91 pKa = 4.02LDD93 pKa = 3.11IYY95 pKa = 11.17GGFKK99 pKa = 10.65FPVGDD104 pKa = 4.29GGTLDD109 pKa = 5.14VGVTWYY115 pKa = 8.57MYY117 pKa = 10.39PGGADD122 pKa = 3.12VTDD125 pKa = 3.98FAEE128 pKa = 5.02PYY130 pKa = 10.14VKK132 pKa = 10.67LSGTAGPVSLTAGVFYY148 pKa = 10.72APKK151 pKa = 10.16QEE153 pKa = 4.07ALGDD157 pKa = 3.85VFFTGAAAASGIPDD171 pKa = 4.22DD172 pKa = 5.5PGDD175 pKa = 4.36SEE177 pKa = 5.69DD178 pKa = 3.93NLYY181 pKa = 11.18LSGDD185 pKa = 3.49AVFAIPEE192 pKa = 4.48TPVSLRR198 pKa = 11.84GHH200 pKa = 6.71IGYY203 pKa = 9.99SDD205 pKa = 4.0GNPGLGPNGTSVAPTGQYY223 pKa = 9.57WDD225 pKa = 3.71WNLGADD231 pKa = 3.8VSVLGLTLGVSYY243 pKa = 10.94IDD245 pKa = 3.83TDD247 pKa = 3.28ISAADD252 pKa = 3.76GAYY255 pKa = 10.77LLPNFQKK262 pKa = 8.08TTGGSIADD270 pKa = 3.66GTIVVSLTAAFF281 pKa = 3.94
Molecular weight: 28.88 kDa
Isoelectric point according different methods:
Protein with the highest isoelectric point:
>tr|A0A4U1L0N4|A0A4U1L0N4_9SPHN Uncharacterized protein OS=Sphingomonas sp. L-1-4w-11 OX=2572576 GN=FBR43_05690 PE=4 SV=1
MM1 pKa = 7.45KK2 pKa = 9.61RR3 pKa = 11.84TFQPSNLVRR12 pKa = 11.84ARR14 pKa = 11.84RR15 pKa = 11.84HH16 pKa = 4.82GFFARR21 pKa = 11.84MATAAGRR28 pKa = 11.84KK29 pKa = 8.9VIRR32 pKa = 11.84ARR34 pKa = 11.84RR35 pKa = 11.84ARR37 pKa = 11.84GRR39 pKa = 11.84KK40 pKa = 9.02KK41 pKa = 10.61LSAA44 pKa = 4.03
MM1 pKa = 7.45KK2 pKa = 9.61RR3 pKa = 11.84TFQPSNLVRR12 pKa = 11.84ARR14 pKa = 11.84RR15 pKa = 11.84HH16 pKa = 4.82GFFARR21 pKa = 11.84MATAAGRR28 pKa = 11.84KK29 pKa = 8.9VIRR32 pKa = 11.84ARR34 pKa = 11.84RR35 pKa = 11.84ARR37 pKa = 11.84GRR39 pKa = 11.84KK40 pKa = 9.02KK41 pKa = 10.61LSAA44 pKa = 4.03
Molecular weight: 5.08 kDa
Isoelectric point according different methods:
Peptides (in silico digests for buttom-up proteomics)
Below you can find in silico digests of the whole proteome with Trypsin, Chymotrypsin, Trypsin+LysC, LysN, ArgC proteases suitable for different mass spec machines.| Try ESI |
 |
|---|
| ChTry ESI |
 |
|---|
| ArgC ESI |
 |
|---|
| LysN ESI |
 |
|---|
| TryLysC ESI |
 |
|---|
| Try MALDI |
 |
|---|
| ChTry MALDI |
 |
|---|
| ArgC MALDI |
 |
|---|
| LysN MALDI |
 |
|---|
| TryLysC MALDI |
 |
|---|
| Try LTQ |
 |
|---|
| ChTry LTQ |
 |
|---|
| ArgC LTQ |
 |
|---|
| LysN LTQ |
 |
|---|
| TryLysC LTQ |
 |
|---|
| Try MSlow |
 |
|---|
| ChTry MSlow |
 |
|---|
| ArgC MSlow |
 |
|---|
| LysN MSlow |
 |
|---|
| TryLysC MSlow |
 |
|---|
| Try MShigh |
 |
|---|
| ChTry MShigh |
 |
|---|
| ArgC MShigh |
 |
|---|
| LysN MShigh |
 |
|---|
| TryLysC MShigh |
 |
|---|
General Statistics
Number of major isoforms |
Number of additional isoforms |
Number of all proteins |
Number of amino acids |
Min. Seq. Length |
Max. Seq. Length |
Avg. Seq. Length |
Avg. Mol. Weight |
|---|---|---|---|---|---|---|---|
0 |
998105 |
29 |
4506 |
321.1 |
34.49 |
Amino acid frequency
Ala |
Cys |
Asp |
Glu |
Phe |
Gly |
His |
Ile |
Lys |
Leu |
|---|---|---|---|---|---|---|---|---|---|
14.954 ± 0.084 | 0.739 ± 0.013 |
6.111 ± 0.043 | 5.318 ± 0.04 |
3.401 ± 0.028 | 9.05 ± 0.045 |
1.961 ± 0.022 | 4.779 ± 0.023 |
2.233 ± 0.038 | 9.867 ± 0.054 |
Met |
Asn |
Gln |
Pro |
Arg |
Ser |
Thr |
Val |
Trp |
Tyr |
|---|---|---|---|---|---|---|---|---|---|
2.36 ± 0.021 | 2.249 ± 0.03 |
5.464 ± 0.03 | 2.895 ± 0.025 |
8.121 ± 0.047 | 4.603 ± 0.031 |
5.147 ± 0.036 | 7.286 ± 0.031 |
1.412 ± 0.02 | 2.049 ± 0.023 |
Most of the basic statistics you can see at this page can be downloaded from this CSV file
Proteome-pI is available under Creative Commons Attribution-NoDerivs license, for more details see here
| Reference: Kozlowski LP. Proteome-pI 2.0: Proteome Isoelectric Point Database Update. Nucleic Acids Res. 2021, doi: 10.1093/nar/gkab944 | Contact: Lukasz P. Kozlowski |
