Halolactibacillus miurensis
Taxonomy: cellular organisms; Bacteria; Terrabacteria group; Firmicutes; Bacilli; Bacillales; Bacillaceae; Halolactibacillus
Average proteome isoelectric point is 6.04
Get precalculated fractions of proteins

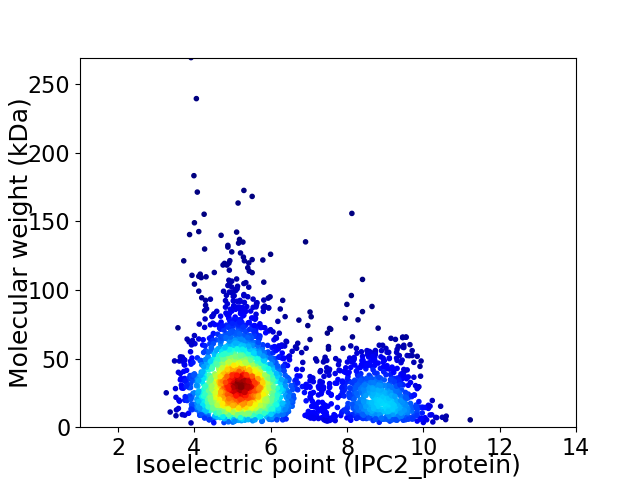
Virtual 2D-PAGE plot for 3011 proteins (isoelectric point calculated using IPC2_protein)
Get csv file with sequences according to given criteria:
* You can choose from 21 different methods for calculating isoelectric point
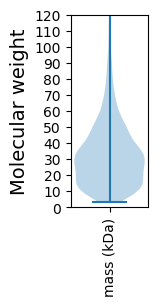
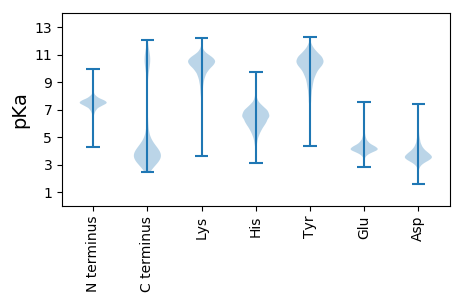
Summary statistics related to proteome-wise predictions


Protein with the lowest isoelectric point:
>tr|A0A1I6SCH3|A0A1I6SCH3_9BACI Lysophospholipase alpha-beta hydrolase superfamily OS=Halolactibacillus miurensis OX=306541 GN=SAMN05421668_10879 PE=4 SV=1
MM1 pKa = 7.42KK2 pKa = 10.41KK3 pKa = 9.96IFTLLLILMLGVLAACGGDD22 pKa = 3.52DD23 pKa = 4.68TSNDD27 pKa = 3.51DD28 pKa = 3.82TGGSDD33 pKa = 3.91SDD35 pKa = 3.83NGTDD39 pKa = 4.34SGEE42 pKa = 4.28TSDD45 pKa = 4.91GVQSVTAWAWDD56 pKa = 3.53PNFNIRR62 pKa = 11.84ALEE65 pKa = 4.09LANQAYY71 pKa = 10.54DD72 pKa = 3.99GDD74 pKa = 3.99SEE76 pKa = 4.73MYY78 pKa = 10.76VEE80 pKa = 5.18IIEE83 pKa = 4.3NAQDD87 pKa = 5.55DD88 pKa = 4.38IIQRR92 pKa = 11.84LNAGLSSGTTQGMPNIVLIEE112 pKa = 4.37DD113 pKa = 3.41YY114 pKa = 10.36RR115 pKa = 11.84AQSFLQSYY123 pKa = 9.77PDD125 pKa = 3.33AFYY128 pKa = 10.81PLTDD132 pKa = 4.51YY133 pKa = 11.31INPDD137 pKa = 3.18DD138 pKa = 3.84FAQYY142 pKa = 10.33KK143 pKa = 9.65VEE145 pKa = 4.01ATSFDD150 pKa = 3.21GDD152 pKa = 3.47IYY154 pKa = 11.22GLPFDD159 pKa = 4.35TGVSGLYY166 pKa = 10.3VRR168 pKa = 11.84TDD170 pKa = 3.52YY171 pKa = 11.53LEE173 pKa = 4.16EE174 pKa = 5.52AGYY177 pKa = 8.13TVEE180 pKa = 5.12DD181 pKa = 4.4LSDD184 pKa = 3.74ITWKK188 pKa = 10.63EE189 pKa = 3.63YY190 pKa = 10.57IEE192 pKa = 4.16IGKK195 pKa = 8.45EE196 pKa = 3.73VKK198 pKa = 10.27AATGKK203 pKa = 10.66DD204 pKa = 4.07MITLDD209 pKa = 4.03PNDD212 pKa = 3.76FGMVRR217 pKa = 11.84MMLQSAGEE225 pKa = 4.14WYY227 pKa = 10.54FEE229 pKa = 4.25EE230 pKa = 5.86DD231 pKa = 3.58GNTPALADD239 pKa = 3.62NPALEE244 pKa = 4.97EE245 pKa = 3.91IFVLYY250 pKa = 10.63KK251 pKa = 11.1EE252 pKa = 4.67MMDD255 pKa = 3.73ADD257 pKa = 3.84IVKK260 pKa = 10.5LNSDD264 pKa = 3.29WSQFVSAFNSGDD276 pKa = 3.47VATVPTGNWITPSVKK291 pKa = 10.57AEE293 pKa = 3.85ASQSGNWAVLPLPRR307 pKa = 11.84LEE309 pKa = 3.99VDD311 pKa = 3.55GAVNTSNLGGSSWYY325 pKa = 10.4VLNQDD330 pKa = 3.65GKK332 pKa = 9.71EE333 pKa = 3.77LAAEE337 pKa = 4.52FLANTFGSNEE347 pKa = 3.71QFYY350 pKa = 10.19TDD352 pKa = 4.1LVTEE356 pKa = 4.69IGALGTYY363 pKa = 9.91IPGTQGEE370 pKa = 4.44AFEE373 pKa = 4.65QEE375 pKa = 4.32DD376 pKa = 4.51PFFGGQAIIQDD387 pKa = 4.0FATWSEE393 pKa = 4.06QIPPVNYY400 pKa = 10.22GMHH403 pKa = 6.74TYY405 pKa = 10.8AVDD408 pKa = 5.4DD409 pKa = 3.78ILKK412 pKa = 10.43VEE414 pKa = 4.08MQNYY418 pKa = 9.97LNGADD423 pKa = 3.81VGDD426 pKa = 4.1VLDD429 pKa = 4.37NAQSQAEE436 pKa = 4.3TQLRR440 pKa = 3.75
MM1 pKa = 7.42KK2 pKa = 10.41KK3 pKa = 9.96IFTLLLILMLGVLAACGGDD22 pKa = 3.52DD23 pKa = 4.68TSNDD27 pKa = 3.51DD28 pKa = 3.82TGGSDD33 pKa = 3.91SDD35 pKa = 3.83NGTDD39 pKa = 4.34SGEE42 pKa = 4.28TSDD45 pKa = 4.91GVQSVTAWAWDD56 pKa = 3.53PNFNIRR62 pKa = 11.84ALEE65 pKa = 4.09LANQAYY71 pKa = 10.54DD72 pKa = 3.99GDD74 pKa = 3.99SEE76 pKa = 4.73MYY78 pKa = 10.76VEE80 pKa = 5.18IIEE83 pKa = 4.3NAQDD87 pKa = 5.55DD88 pKa = 4.38IIQRR92 pKa = 11.84LNAGLSSGTTQGMPNIVLIEE112 pKa = 4.37DD113 pKa = 3.41YY114 pKa = 10.36RR115 pKa = 11.84AQSFLQSYY123 pKa = 9.77PDD125 pKa = 3.33AFYY128 pKa = 10.81PLTDD132 pKa = 4.51YY133 pKa = 11.31INPDD137 pKa = 3.18DD138 pKa = 3.84FAQYY142 pKa = 10.33KK143 pKa = 9.65VEE145 pKa = 4.01ATSFDD150 pKa = 3.21GDD152 pKa = 3.47IYY154 pKa = 11.22GLPFDD159 pKa = 4.35TGVSGLYY166 pKa = 10.3VRR168 pKa = 11.84TDD170 pKa = 3.52YY171 pKa = 11.53LEE173 pKa = 4.16EE174 pKa = 5.52AGYY177 pKa = 8.13TVEE180 pKa = 5.12DD181 pKa = 4.4LSDD184 pKa = 3.74ITWKK188 pKa = 10.63EE189 pKa = 3.63YY190 pKa = 10.57IEE192 pKa = 4.16IGKK195 pKa = 8.45EE196 pKa = 3.73VKK198 pKa = 10.27AATGKK203 pKa = 10.66DD204 pKa = 4.07MITLDD209 pKa = 4.03PNDD212 pKa = 3.76FGMVRR217 pKa = 11.84MMLQSAGEE225 pKa = 4.14WYY227 pKa = 10.54FEE229 pKa = 4.25EE230 pKa = 5.86DD231 pKa = 3.58GNTPALADD239 pKa = 3.62NPALEE244 pKa = 4.97EE245 pKa = 3.91IFVLYY250 pKa = 10.63KK251 pKa = 11.1EE252 pKa = 4.67MMDD255 pKa = 3.73ADD257 pKa = 3.84IVKK260 pKa = 10.5LNSDD264 pKa = 3.29WSQFVSAFNSGDD276 pKa = 3.47VATVPTGNWITPSVKK291 pKa = 10.57AEE293 pKa = 3.85ASQSGNWAVLPLPRR307 pKa = 11.84LEE309 pKa = 3.99VDD311 pKa = 3.55GAVNTSNLGGSSWYY325 pKa = 10.4VLNQDD330 pKa = 3.65GKK332 pKa = 9.71EE333 pKa = 3.77LAAEE337 pKa = 4.52FLANTFGSNEE347 pKa = 3.71QFYY350 pKa = 10.19TDD352 pKa = 4.1LVTEE356 pKa = 4.69IGALGTYY363 pKa = 9.91IPGTQGEE370 pKa = 4.44AFEE373 pKa = 4.65QEE375 pKa = 4.32DD376 pKa = 4.51PFFGGQAIIQDD387 pKa = 4.0FATWSEE393 pKa = 4.06QIPPVNYY400 pKa = 10.22GMHH403 pKa = 6.74TYY405 pKa = 10.8AVDD408 pKa = 5.4DD409 pKa = 3.78ILKK412 pKa = 10.43VEE414 pKa = 4.08MQNYY418 pKa = 9.97LNGADD423 pKa = 3.81VGDD426 pKa = 4.1VLDD429 pKa = 4.37NAQSQAEE436 pKa = 4.3TQLRR440 pKa = 3.75
Molecular weight: 48.24 kDa
Isoelectric point according different methods:
Protein with the highest isoelectric point:
>tr|A0A1I6NW54|A0A1I6NW54_9BACI Uncharacterized protein OS=Halolactibacillus miurensis OX=306541 GN=SAMN05421668_10126 PE=4 SV=1
MM1 pKa = 7.44KK2 pKa = 9.6RR3 pKa = 11.84TFQPNNRR10 pKa = 11.84KK11 pKa = 9.23RR12 pKa = 11.84KK13 pKa = 8.49KK14 pKa = 8.63VHH16 pKa = 5.57GFRR19 pKa = 11.84KK20 pKa = 10.01RR21 pKa = 11.84MSTKK25 pKa = 10.25NGRR28 pKa = 11.84LVLKK32 pKa = 10.3RR33 pKa = 11.84RR34 pKa = 11.84RR35 pKa = 11.84SKK37 pKa = 10.56GRR39 pKa = 11.84KK40 pKa = 8.44VLSAA44 pKa = 4.05
MM1 pKa = 7.44KK2 pKa = 9.6RR3 pKa = 11.84TFQPNNRR10 pKa = 11.84KK11 pKa = 9.23RR12 pKa = 11.84KK13 pKa = 8.49KK14 pKa = 8.63VHH16 pKa = 5.57GFRR19 pKa = 11.84KK20 pKa = 10.01RR21 pKa = 11.84MSTKK25 pKa = 10.25NGRR28 pKa = 11.84LVLKK32 pKa = 10.3RR33 pKa = 11.84RR34 pKa = 11.84RR35 pKa = 11.84SKK37 pKa = 10.56GRR39 pKa = 11.84KK40 pKa = 8.44VLSAA44 pKa = 4.05
Molecular weight: 5.34 kDa
Isoelectric point according different methods:
Peptides (in silico digests for buttom-up proteomics)
Below you can find in silico digests of the whole proteome with Trypsin, Chymotrypsin, Trypsin+LysC, LysN, ArgC proteases suitable for different mass spec machines.| Try ESI |
 |
|---|
| ChTry ESI |
 |
|---|
| ArgC ESI |
 |
|---|
| LysN ESI |
 |
|---|
| TryLysC ESI |
 |
|---|
| Try MALDI |
 |
|---|
| ChTry MALDI |
 |
|---|
| ArgC MALDI |
 |
|---|
| LysN MALDI |
 |
|---|
| TryLysC MALDI |
 |
|---|
| Try LTQ |
 |
|---|
| ChTry LTQ |
 |
|---|
| ArgC LTQ |
 |
|---|
| LysN LTQ |
 |
|---|
| TryLysC LTQ |
 |
|---|
| Try MSlow |
 |
|---|
| ChTry MSlow |
 |
|---|
| ArgC MSlow |
 |
|---|
| LysN MSlow |
 |
|---|
| TryLysC MSlow |
 |
|---|
| Try MShigh |
 |
|---|
| ChTry MShigh |
 |
|---|
| ArgC MShigh |
 |
|---|
| LysN MShigh |
 |
|---|
| TryLysC MShigh |
 |
|---|
General Statistics
Number of major isoforms |
Number of additional isoforms |
Number of all proteins |
Number of amino acids |
Min. Seq. Length |
Max. Seq. Length |
Avg. Seq. Length |
Avg. Mol. Weight |
|---|---|---|---|---|---|---|---|
0 |
919271 |
29 |
2419 |
305.3 |
34.45 |
Amino acid frequency
Ala |
Cys |
Asp |
Glu |
Phe |
Gly |
His |
Ile |
Lys |
Leu |
|---|---|---|---|---|---|---|---|---|---|
6.651 ± 0.041 | 0.555 ± 0.013 |
6.214 ± 0.04 | 7.205 ± 0.049 |
4.481 ± 0.032 | 6.277 ± 0.043 |
2.431 ± 0.026 | 7.462 ± 0.046 |
6.368 ± 0.047 | 9.876 ± 0.047 |
Met |
Asn |
Gln |
Pro |
Arg |
Ser |
Thr |
Val |
Trp |
Tyr |
|---|---|---|---|---|---|---|---|---|---|
2.798 ± 0.023 | 4.211 ± 0.035 |
3.398 ± 0.022 | 4.131 ± 0.032 |
4.095 ± 0.032 | 5.743 ± 0.034 |
6.188 ± 0.036 | 7.218 ± 0.039 |
0.876 ± 0.016 | 3.821 ± 0.033 |
Most of the basic statistics you can see at this page can be downloaded from this CSV file
Proteome-pI is available under Creative Commons Attribution-NoDerivs license, for more details see here
| Reference: Kozlowski LP. Proteome-pI 2.0: Proteome Isoelectric Point Database Update. Nucleic Acids Res. 2021, doi: 10.1093/nar/gkab944 | Contact: Lukasz P. Kozlowski |
