Nitrospira sp. KM1
Taxonomy: cellular organisms; Bacteria; Nitrospirae; Nitrospira; Nitrospirales; Nitrospiraceae; Nitrospira; unclassified Nitrospira
Average proteome isoelectric point is 6.8
Get precalculated fractions of proteins

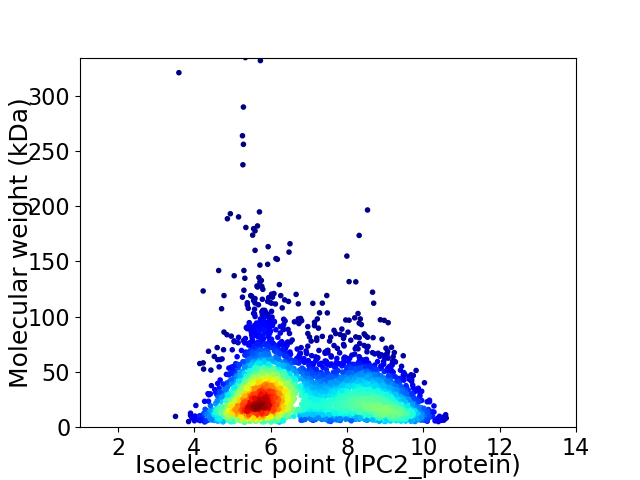
Virtual 2D-PAGE plot for 4311 proteins (isoelectric point calculated using IPC2_protein)
Get csv file with sequences according to given criteria:
* You can choose from 21 different methods for calculating isoelectric point
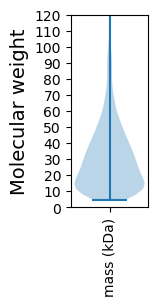
Summary statistics related to proteome-wise predictions


Protein with the lowest isoelectric point:
>tr|A0A679HX64|A0A679HX64_9BACT Ribosome-binding factor A OS=Nitrospira sp. KM1 OX=1936990 GN=rbfA PE=3 SV=1
MM1 pKa = 7.59SGTPVAGGGVHH12 pKa = 5.93YY13 pKa = 9.24FANAFAVTPDD23 pKa = 3.05SSAIVYY29 pKa = 9.74LADD32 pKa = 3.44EE33 pKa = 4.46TTDD36 pKa = 3.69NVLEE40 pKa = 4.49TYY42 pKa = 10.03RR43 pKa = 11.84VPFTTPGSSTRR54 pKa = 11.84LNGPIVAGGSVSSLLGFSILPDD76 pKa = 3.26SSGIVYY82 pKa = 10.27AADD85 pKa = 3.45EE86 pKa = 4.4AVDD89 pKa = 5.04DD90 pKa = 4.63VIEE93 pKa = 4.67LYY95 pKa = 10.69RR96 pKa = 11.84SDD98 pKa = 3.83FSTPGVSTKK107 pKa = 10.66QNGPLVAGGNVDD119 pKa = 3.54GFIVQQ124 pKa = 3.75
MM1 pKa = 7.59SGTPVAGGGVHH12 pKa = 5.93YY13 pKa = 9.24FANAFAVTPDD23 pKa = 3.05SSAIVYY29 pKa = 9.74LADD32 pKa = 3.44EE33 pKa = 4.46TTDD36 pKa = 3.69NVLEE40 pKa = 4.49TYY42 pKa = 10.03RR43 pKa = 11.84VPFTTPGSSTRR54 pKa = 11.84LNGPIVAGGSVSSLLGFSILPDD76 pKa = 3.26SSGIVYY82 pKa = 10.27AADD85 pKa = 3.45EE86 pKa = 4.4AVDD89 pKa = 5.04DD90 pKa = 4.63VIEE93 pKa = 4.67LYY95 pKa = 10.69RR96 pKa = 11.84SDD98 pKa = 3.83FSTPGVSTKK107 pKa = 10.66QNGPLVAGGNVDD119 pKa = 3.54GFIVQQ124 pKa = 3.75
Molecular weight: 12.68 kDa
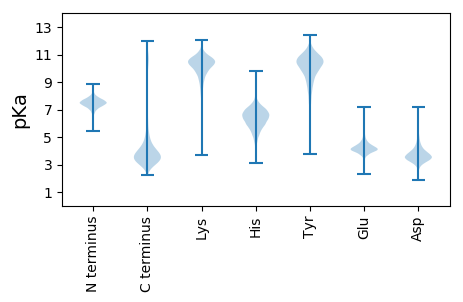
Isoelectric point according different methods:
Protein with the highest isoelectric point:
>tr|A0A679I432|A0A679I432_9BACT Uncharacterized protein OS=Nitrospira sp. KM1 OX=1936990 GN=W02_35850 PE=4 SV=1
MM1 pKa = 7.67FEE3 pKa = 4.35RR4 pKa = 11.84IIRR7 pKa = 11.84SVSGFVRR14 pKa = 11.84GLRR17 pKa = 11.84LTWHH21 pKa = 6.06IVKK24 pKa = 10.29GALITAIHH32 pKa = 6.36FRR34 pKa = 11.84HH35 pKa = 6.62ADD37 pKa = 3.42PNEE40 pKa = 4.16RR41 pKa = 11.84DD42 pKa = 3.5VMIQQWSRR50 pKa = 11.84ACLAILNVRR59 pKa = 11.84LRR61 pKa = 11.84IHH63 pKa = 6.93GDD65 pKa = 3.46VPSSAPAILFAANHH79 pKa = 5.64VSWLDD84 pKa = 3.37ILGLNAVKK92 pKa = 10.4RR93 pKa = 11.84VRR95 pKa = 11.84FVAKK99 pKa = 10.21SEE101 pKa = 3.87VRR103 pKa = 11.84RR104 pKa = 11.84WPLVGWLAKK113 pKa = 10.26QADD116 pKa = 3.89TLFIKK121 pKa = 10.53RR122 pKa = 11.84NSPSEE127 pKa = 4.29LIPINRR133 pKa = 11.84SLHH136 pKa = 5.39IALKK140 pKa = 9.94GGQSVGLFPEE150 pKa = 5.1GTTSSGRR157 pKa = 11.84SVLRR161 pKa = 11.84FHH163 pKa = 7.47SGLFEE168 pKa = 4.21SAVTSRR174 pKa = 11.84SAVCPVALSYY184 pKa = 8.94QTSDD188 pKa = 2.6GHH190 pKa = 5.96PCFRR194 pKa = 11.84AAFVGNQTLLASIWNVLTLPVLYY217 pKa = 10.64LNLHH221 pKa = 6.19FMPPLSSSQFDD232 pKa = 3.21RR233 pKa = 11.84HH234 pKa = 5.9EE235 pKa = 4.43LSQHH239 pKa = 5.19ARR241 pKa = 11.84TAILAKK247 pKa = 10.26VSHH250 pKa = 6.26TEE252 pKa = 4.23CPWSVAHH259 pKa = 6.92AAGSQVEE266 pKa = 4.54CAHH269 pKa = 6.63RR270 pKa = 4.09
MM1 pKa = 7.67FEE3 pKa = 4.35RR4 pKa = 11.84IIRR7 pKa = 11.84SVSGFVRR14 pKa = 11.84GLRR17 pKa = 11.84LTWHH21 pKa = 6.06IVKK24 pKa = 10.29GALITAIHH32 pKa = 6.36FRR34 pKa = 11.84HH35 pKa = 6.62ADD37 pKa = 3.42PNEE40 pKa = 4.16RR41 pKa = 11.84DD42 pKa = 3.5VMIQQWSRR50 pKa = 11.84ACLAILNVRR59 pKa = 11.84LRR61 pKa = 11.84IHH63 pKa = 6.93GDD65 pKa = 3.46VPSSAPAILFAANHH79 pKa = 5.64VSWLDD84 pKa = 3.37ILGLNAVKK92 pKa = 10.4RR93 pKa = 11.84VRR95 pKa = 11.84FVAKK99 pKa = 10.21SEE101 pKa = 3.87VRR103 pKa = 11.84RR104 pKa = 11.84WPLVGWLAKK113 pKa = 10.26QADD116 pKa = 3.89TLFIKK121 pKa = 10.53RR122 pKa = 11.84NSPSEE127 pKa = 4.29LIPINRR133 pKa = 11.84SLHH136 pKa = 5.39IALKK140 pKa = 9.94GGQSVGLFPEE150 pKa = 5.1GTTSSGRR157 pKa = 11.84SVLRR161 pKa = 11.84FHH163 pKa = 7.47SGLFEE168 pKa = 4.21SAVTSRR174 pKa = 11.84SAVCPVALSYY184 pKa = 8.94QTSDD188 pKa = 2.6GHH190 pKa = 5.96PCFRR194 pKa = 11.84AAFVGNQTLLASIWNVLTLPVLYY217 pKa = 10.64LNLHH221 pKa = 6.19FMPPLSSSQFDD232 pKa = 3.21RR233 pKa = 11.84HH234 pKa = 5.9EE235 pKa = 4.43LSQHH239 pKa = 5.19ARR241 pKa = 11.84TAILAKK247 pKa = 10.26VSHH250 pKa = 6.26TEE252 pKa = 4.23CPWSVAHH259 pKa = 6.92AAGSQVEE266 pKa = 4.54CAHH269 pKa = 6.63RR270 pKa = 4.09
Molecular weight: 29.94 kDa
Isoelectric point according different methods:
Peptides (in silico digests for buttom-up proteomics)
Below you can find in silico digests of the whole proteome with Trypsin, Chymotrypsin, Trypsin+LysC, LysN, ArgC proteases suitable for different mass spec machines.| Try ESI |
 |
|---|
| ChTry ESI |
 |
|---|
| ArgC ESI |
 |
|---|
| LysN ESI |
 |
|---|
| TryLysC ESI |
 |
|---|
| Try MALDI |
 |
|---|
| ChTry MALDI |
 |
|---|
| ArgC MALDI |
 |
|---|
| LysN MALDI |
 |
|---|
| TryLysC MALDI |
 |
|---|
| Try LTQ |
 |
|---|
| ChTry LTQ |
 |
|---|
| ArgC LTQ |
 |
|---|
| LysN LTQ |
 |
|---|
| TryLysC LTQ |
 |
|---|
| Try MSlow |
 |
|---|
| ChTry MSlow |
 |
|---|
| ArgC MSlow |
 |
|---|
| LysN MSlow |
 |
|---|
| TryLysC MSlow |
 |
|---|
| Try MShigh |
 |
|---|
| ChTry MShigh |
 |
|---|
| ArgC MShigh |
 |
|---|
| LysN MShigh |
 |
|---|
| TryLysC MShigh |
 |
|---|
General Statistics
Number of major isoforms |
Number of additional isoforms |
Number of all proteins |
Number of amino acids |
Min. Seq. Length |
Max. Seq. Length |
Avg. Seq. Length |
Avg. Mol. Weight |
|---|---|---|---|---|---|---|---|
0 |
1283078 |
40 |
3133 |
297.6 |
32.83 |
Amino acid frequency
Ala |
Cys |
Asp |
Glu |
Phe |
Gly |
His |
Ile |
Lys |
Leu |
|---|---|---|---|---|---|---|---|---|---|
9.511 ± 0.041 | 0.966 ± 0.014 |
5.295 ± 0.025 | 5.84 ± 0.037 |
3.729 ± 0.023 | 7.91 ± 0.043 |
2.403 ± 0.018 | 5.384 ± 0.027 |
3.984 ± 0.035 | 10.226 ± 0.044 |
Met |
Asn |
Gln |
Pro |
Arg |
Ser |
Thr |
Val |
Trp |
Tyr |
|---|---|---|---|---|---|---|---|---|---|
2.498 ± 0.018 | 2.904 ± 0.03 |
5.034 ± 0.031 | 3.895 ± 0.022 |
6.917 ± 0.038 | 6.176 ± 0.03 |
5.729 ± 0.038 | 7.621 ± 0.036 |
1.343 ± 0.017 | 2.634 ± 0.023 |
Most of the basic statistics you can see at this page can be downloaded from this CSV file
Proteome-pI is available under Creative Commons Attribution-NoDerivs license, for more details see here
| Reference: Kozlowski LP. Proteome-pI 2.0: Proteome Isoelectric Point Database Update. Nucleic Acids Res. 2021, doi: 10.1093/nar/gkab944 | Contact: Lukasz P. Kozlowski |
