Syncephalis pseudoplumigaleata
Taxonomy: cellular organisms; Eukaryota; Opisthokonta; Fungi; Fungi incertae sedis; Zoopagomycota; Zoopagomycotina; Zoopagomycetes; Zoopagales; Piptocephalidaceae; Syncephalis
Average proteome isoelectric point is 6.7
Get precalculated fractions of proteins

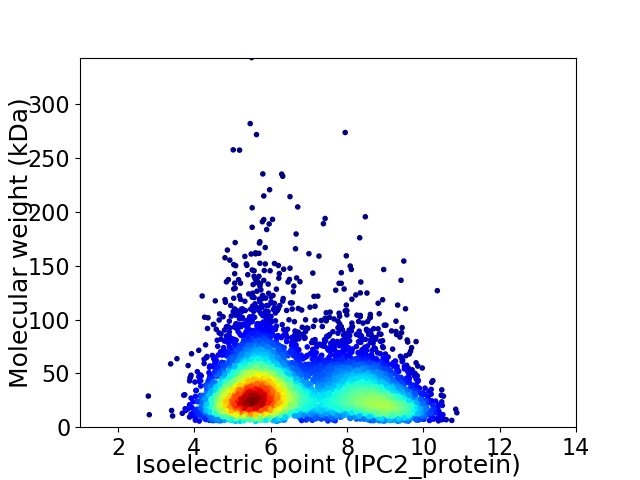
Virtual 2D-PAGE plot for 5997 proteins (isoelectric point calculated using IPC2_protein)
Get csv file with sequences according to given criteria:
* You can choose from 21 different methods for calculating isoelectric point
Summary statistics related to proteome-wise predictions


Protein with the lowest isoelectric point:
>tr|A0A4P9YT38|A0A4P9YT38_9FUNG Uncharacterized protein OS=Syncephalis pseudoplumigaleata OX=1712513 GN=SYNPS1DRAFT_24887 PE=4 SV=1
MM1 pKa = 7.51SGQLEE6 pKa = 4.42MPDD9 pKa = 3.46AASATQLATAEE20 pKa = 4.44ILNHH24 pKa = 6.42PASSQNDD31 pKa = 3.18PMIFANNNNNSNNSGDD47 pKa = 4.06SNHH50 pKa = 6.64TGAASGGIQPQHH62 pKa = 6.66LPLSPPDD69 pKa = 3.77EE70 pKa = 4.27QKK72 pKa = 11.2LEE74 pKa = 4.21CTTLDD79 pKa = 3.49ASDD82 pKa = 4.14VSWISSKK89 pKa = 11.29SMPATPYY96 pKa = 10.95ASDD99 pKa = 3.5AVTSASMFSSNVLALQQQNEE119 pKa = 4.5SASDD123 pKa = 3.49ASMSAADD130 pKa = 4.19DD131 pKa = 4.02AACEE135 pKa = 4.11GMPSCVQRR143 pKa = 11.84LLRR146 pKa = 11.84LDD148 pKa = 3.83PDD150 pKa = 3.43VWEE153 pKa = 5.14HH154 pKa = 6.43GSIDD158 pKa = 3.83SDD160 pKa = 4.22IVCCYY165 pKa = 9.67HH166 pKa = 7.57DD167 pKa = 3.77VVLRR171 pKa = 11.84VDD173 pKa = 4.15DD174 pKa = 5.22LRR176 pKa = 11.84LLSPGQWLNDD186 pKa = 2.96TWIEE190 pKa = 3.98FFYY193 pKa = 10.85EE194 pKa = 3.93
MM1 pKa = 7.51SGQLEE6 pKa = 4.42MPDD9 pKa = 3.46AASATQLATAEE20 pKa = 4.44ILNHH24 pKa = 6.42PASSQNDD31 pKa = 3.18PMIFANNNNNSNNSGDD47 pKa = 4.06SNHH50 pKa = 6.64TGAASGGIQPQHH62 pKa = 6.66LPLSPPDD69 pKa = 3.77EE70 pKa = 4.27QKK72 pKa = 11.2LEE74 pKa = 4.21CTTLDD79 pKa = 3.49ASDD82 pKa = 4.14VSWISSKK89 pKa = 11.29SMPATPYY96 pKa = 10.95ASDD99 pKa = 3.5AVTSASMFSSNVLALQQQNEE119 pKa = 4.5SASDD123 pKa = 3.49ASMSAADD130 pKa = 4.19DD131 pKa = 4.02AACEE135 pKa = 4.11GMPSCVQRR143 pKa = 11.84LLRR146 pKa = 11.84LDD148 pKa = 3.83PDD150 pKa = 3.43VWEE153 pKa = 5.14HH154 pKa = 6.43GSIDD158 pKa = 3.83SDD160 pKa = 4.22IVCCYY165 pKa = 9.67HH166 pKa = 7.57DD167 pKa = 3.77VVLRR171 pKa = 11.84VDD173 pKa = 4.15DD174 pKa = 5.22LRR176 pKa = 11.84LLSPGQWLNDD186 pKa = 2.96TWIEE190 pKa = 3.98FFYY193 pKa = 10.85EE194 pKa = 3.93
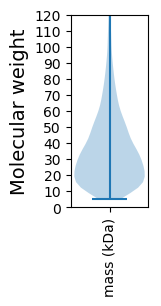
Molecular weight: 20.85 kDa
Isoelectric point according different methods:
Protein with the highest isoelectric point:
>tr|A0A4V1J1N7|A0A4V1J1N7_9FUNG ArAE_2 domain-containing protein OS=Syncephalis pseudoplumigaleata OX=1712513 GN=SYNPS1DRAFT_28574 PE=4 SV=1
MM1 pKa = 6.46TTSALTWLLLKK12 pKa = 10.24KK13 pKa = 10.18QSRR16 pKa = 11.84FVVKK20 pKa = 10.47RR21 pKa = 11.84AGAEE25 pKa = 4.15FNTEE29 pKa = 4.03PGNLTNKK36 pKa = 8.36NTFTSSSLVNKK47 pKa = 10.25SVVLAAGPKK56 pKa = 9.45GKK58 pKa = 9.98GVKK61 pKa = 8.44LTQPSGRR68 pKa = 11.84VVKK71 pKa = 9.1LTRR74 pKa = 11.84GAARR78 pKa = 11.84AARR81 pKa = 11.84TVSGAVRR88 pKa = 11.84PQQRR92 pKa = 11.84RR93 pKa = 11.84VALARR98 pKa = 11.84MSAILRR104 pKa = 11.84AQRR107 pKa = 11.84PVKK110 pKa = 9.79ATTFKK115 pKa = 10.29RR116 pKa = 11.84TGIRR120 pKa = 11.84ATRR123 pKa = 11.84KK124 pKa = 9.47
MM1 pKa = 6.46TTSALTWLLLKK12 pKa = 10.24KK13 pKa = 10.18QSRR16 pKa = 11.84FVVKK20 pKa = 10.47RR21 pKa = 11.84AGAEE25 pKa = 4.15FNTEE29 pKa = 4.03PGNLTNKK36 pKa = 8.36NTFTSSSLVNKK47 pKa = 10.25SVVLAAGPKK56 pKa = 9.45GKK58 pKa = 9.98GVKK61 pKa = 8.44LTQPSGRR68 pKa = 11.84VVKK71 pKa = 9.1LTRR74 pKa = 11.84GAARR78 pKa = 11.84AARR81 pKa = 11.84TVSGAVRR88 pKa = 11.84PQQRR92 pKa = 11.84RR93 pKa = 11.84VALARR98 pKa = 11.84MSAILRR104 pKa = 11.84AQRR107 pKa = 11.84PVKK110 pKa = 9.79ATTFKK115 pKa = 10.29RR116 pKa = 11.84TGIRR120 pKa = 11.84ATRR123 pKa = 11.84KK124 pKa = 9.47
Molecular weight: 13.4 kDa
Isoelectric point according different methods:
Peptides (in silico digests for buttom-up proteomics)
Below you can find in silico digests of the whole proteome with Trypsin, Chymotrypsin, Trypsin+LysC, LysN, ArgC proteases suitable for different mass spec machines.| Try ESI |
 |
|---|
| ChTry ESI |
 |
|---|
| ArgC ESI |
 |
|---|
| LysN ESI |
 |
|---|
| TryLysC ESI |
 |
|---|
| Try MALDI |
 |
|---|
| ChTry MALDI |
 |
|---|
| ArgC MALDI |
 |
|---|
| LysN MALDI |
 |
|---|
| TryLysC MALDI |
 |
|---|
| Try LTQ |
 |
|---|
| ChTry LTQ |
 |
|---|
| ArgC LTQ |
 |
|---|
| LysN LTQ |
 |
|---|
| TryLysC LTQ |
 |
|---|
| Try MSlow |
 |
|---|
| ChTry MSlow |
 |
|---|
| ArgC MSlow |
 |
|---|
| LysN MSlow |
 |
|---|
| TryLysC MSlow |
 |
|---|
| Try MShigh |
 |
|---|
| ChTry MShigh |
 |
|---|
| ArgC MShigh |
 |
|---|
| LysN MShigh |
 |
|---|
| TryLysC MShigh |
 |
|---|
General Statistics
Number of major isoforms |
Number of additional isoforms |
Number of all proteins |
Number of amino acids |
Min. Seq. Length |
Max. Seq. Length |
Avg. Seq. Length |
Avg. Mol. Weight |
|---|---|---|---|---|---|---|---|
0 |
2091956 |
49 |
3138 |
348.8 |
38.62 |
Amino acid frequency
Ala |
Cys |
Asp |
Glu |
Phe |
Gly |
His |
Ile |
Lys |
Leu |
|---|---|---|---|---|---|---|---|---|---|
10.446 ± 0.04 | 1.482 ± 0.014 |
5.707 ± 0.025 | 5.796 ± 0.038 |
3.281 ± 0.024 | 6.392 ± 0.03 |
3.032 ± 0.018 | 4.665 ± 0.027 |
3.933 ± 0.028 | 9.275 ± 0.042 |
Met |
Asn |
Gln |
Pro |
Arg |
Ser |
Thr |
Val |
Trp |
Tyr |
|---|---|---|---|---|---|---|---|---|---|
2.69 ± 0.014 | 3.159 ± 0.018 |
5.343 ± 0.034 | 4.174 ± 0.021 |
6.899 ± 0.031 | 7.192 ± 0.041 |
5.923 ± 0.024 | 6.388 ± 0.027 |
1.292 ± 0.011 | 2.932 ± 0.019 |
Most of the basic statistics you can see at this page can be downloaded from this CSV file
Proteome-pI is available under Creative Commons Attribution-NoDerivs license, for more details see here
| Reference: Kozlowski LP. Proteome-pI 2.0: Proteome Isoelectric Point Database Update. Nucleic Acids Res. 2021, doi: 10.1093/nar/gkab944 | Contact: Lukasz P. Kozlowski |
