Fistulina hepatica ATCC 64428
Taxonomy: cellular organisms; Eukaryota; Opisthokonta; Fungi; Dikarya; Basidiomycota; Agaricomycotina; Agaricomycetes; Agaricomycetidae; Agaricales; Fistulinaceae; Fistulina; Fistulina hepatica
Average proteome isoelectric point is 6.51
Get precalculated fractions of proteins

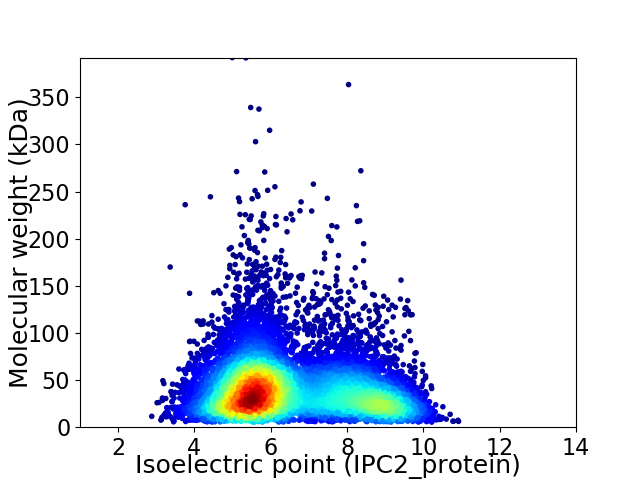
Virtual 2D-PAGE plot for 9322 proteins (isoelectric point calculated using IPC2_protein)
Get csv file with sequences according to given criteria:
* You can choose from 21 different methods for calculating isoelectric point
Summary statistics related to proteome-wise predictions


Protein with the lowest isoelectric point:
>tr|A0A0D7A8A7|A0A0D7A8A7_9AGAR Uncharacterized protein OS=Fistulina hepatica ATCC 64428 OX=1128425 GN=FISHEDRAFT_59972 PE=4 SV=1
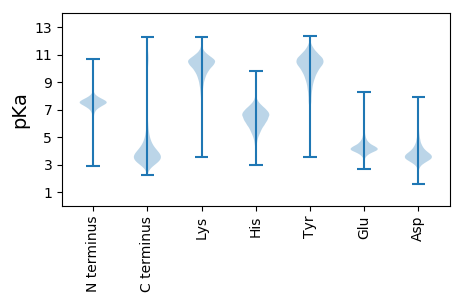
II1 pKa = 7.43SSGWYY6 pKa = 8.91PGWSYY11 pKa = 11.38TEE13 pKa = 4.64SPASDD18 pKa = 4.2LSWSKK23 pKa = 8.46YY24 pKa = 5.83THH26 pKa = 5.98MAFAFATTTSDD37 pKa = 3.58PSVLSLDD44 pKa = 3.89DD45 pKa = 3.95SGGGDD50 pKa = 3.56ALTSFVSAAKK60 pKa = 9.76EE61 pKa = 4.15NNVSALLSVGGWSGSVYY78 pKa = 10.47FSPAMEE84 pKa = 4.28KK85 pKa = 10.6SNRR88 pKa = 11.84ATFVQTIVGLADD100 pKa = 4.12KK101 pKa = 10.88YY102 pKa = 11.63DD103 pKa = 4.21LDD105 pKa = 4.63GVDD108 pKa = 6.2FDD110 pKa = 4.27WEE112 pKa = 4.51YY113 pKa = 10.82PNSDD117 pKa = 2.74GAGNQKK123 pKa = 10.25SSSDD127 pKa = 3.25ARR129 pKa = 11.84NFLAFLKK136 pKa = 10.4DD137 pKa = 3.72LRR139 pKa = 11.84ATDD142 pKa = 3.66TGSKK146 pKa = 10.21LILSASVAITPFNGADD162 pKa = 3.98GEE164 pKa = 4.38PMSDD168 pKa = 2.86VSDD171 pKa = 3.87FADD174 pKa = 3.23VLDD177 pKa = 4.16YY178 pKa = 10.62VQIMAYY184 pKa = 10.28DD185 pKa = 3.66IFTTSSATVGPNAPFQDD202 pKa = 3.41EE203 pKa = 4.57CAASDD208 pKa = 3.85DD209 pKa = 4.0QVGSVVSASDD219 pKa = 3.1VWVDD223 pKa = 3.25AGFPASQILLGVPSYY238 pKa = 11.32GYY240 pKa = 10.37AFVVSEE246 pKa = 4.09EE247 pKa = 4.07DD248 pKa = 3.54AYY250 pKa = 11.67NADD253 pKa = 3.9GLLAEE258 pKa = 4.86YY259 pKa = 9.81PSFDD263 pKa = 3.93ASATPGGASDD273 pKa = 4.63DD274 pKa = 3.77DD275 pKa = 4.52GYY277 pKa = 11.78YY278 pKa = 10.78DD279 pKa = 3.96FSGMIKK285 pKa = 10.48DD286 pKa = 4.05ALLDD290 pKa = 3.61EE291 pKa = 5.36AGEE294 pKa = 4.3VMSNVSYY301 pKa = 11.06RR302 pKa = 11.84FDD304 pKa = 3.72NCSHH308 pKa = 6.61TPYY311 pKa = 10.19IYY313 pKa = 10.22DD314 pKa = 3.48SKK316 pKa = 9.62TSTMVSFDD324 pKa = 3.73DD325 pKa = 4.05AKK327 pKa = 11.12SFAVKK332 pKa = 10.38GSYY335 pKa = 9.86IVDD338 pKa = 3.37KK339 pKa = 10.52GLKK342 pKa = 9.12GFAMWEE348 pKa = 4.31TVSDD352 pKa = 4.15YY353 pKa = 11.67NDD355 pKa = 3.38ILLDD359 pKa = 3.91SIRR362 pKa = 11.84ASLGG366 pKa = 3.24
II1 pKa = 7.43SSGWYY6 pKa = 8.91PGWSYY11 pKa = 11.38TEE13 pKa = 4.64SPASDD18 pKa = 4.2LSWSKK23 pKa = 8.46YY24 pKa = 5.83THH26 pKa = 5.98MAFAFATTTSDD37 pKa = 3.58PSVLSLDD44 pKa = 3.89DD45 pKa = 3.95SGGGDD50 pKa = 3.56ALTSFVSAAKK60 pKa = 9.76EE61 pKa = 4.15NNVSALLSVGGWSGSVYY78 pKa = 10.47FSPAMEE84 pKa = 4.28KK85 pKa = 10.6SNRR88 pKa = 11.84ATFVQTIVGLADD100 pKa = 4.12KK101 pKa = 10.88YY102 pKa = 11.63DD103 pKa = 4.21LDD105 pKa = 4.63GVDD108 pKa = 6.2FDD110 pKa = 4.27WEE112 pKa = 4.51YY113 pKa = 10.82PNSDD117 pKa = 2.74GAGNQKK123 pKa = 10.25SSSDD127 pKa = 3.25ARR129 pKa = 11.84NFLAFLKK136 pKa = 10.4DD137 pKa = 3.72LRR139 pKa = 11.84ATDD142 pKa = 3.66TGSKK146 pKa = 10.21LILSASVAITPFNGADD162 pKa = 3.98GEE164 pKa = 4.38PMSDD168 pKa = 2.86VSDD171 pKa = 3.87FADD174 pKa = 3.23VLDD177 pKa = 4.16YY178 pKa = 10.62VQIMAYY184 pKa = 10.28DD185 pKa = 3.66IFTTSSATVGPNAPFQDD202 pKa = 3.41EE203 pKa = 4.57CAASDD208 pKa = 3.85DD209 pKa = 4.0QVGSVVSASDD219 pKa = 3.1VWVDD223 pKa = 3.25AGFPASQILLGVPSYY238 pKa = 11.32GYY240 pKa = 10.37AFVVSEE246 pKa = 4.09EE247 pKa = 4.07DD248 pKa = 3.54AYY250 pKa = 11.67NADD253 pKa = 3.9GLLAEE258 pKa = 4.86YY259 pKa = 9.81PSFDD263 pKa = 3.93ASATPGGASDD273 pKa = 4.63DD274 pKa = 3.77DD275 pKa = 4.52GYY277 pKa = 11.78YY278 pKa = 10.78DD279 pKa = 3.96FSGMIKK285 pKa = 10.48DD286 pKa = 4.05ALLDD290 pKa = 3.61EE291 pKa = 5.36AGEE294 pKa = 4.3VMSNVSYY301 pKa = 11.06RR302 pKa = 11.84FDD304 pKa = 3.72NCSHH308 pKa = 6.61TPYY311 pKa = 10.19IYY313 pKa = 10.22DD314 pKa = 3.48SKK316 pKa = 9.62TSTMVSFDD324 pKa = 3.73DD325 pKa = 4.05AKK327 pKa = 11.12SFAVKK332 pKa = 10.38GSYY335 pKa = 9.86IVDD338 pKa = 3.37KK339 pKa = 10.52GLKK342 pKa = 9.12GFAMWEE348 pKa = 4.31TVSDD352 pKa = 4.15YY353 pKa = 11.67NDD355 pKa = 3.38ILLDD359 pKa = 3.91SIRR362 pKa = 11.84ASLGG366 pKa = 3.24
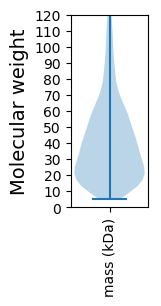
Molecular weight: 38.98 kDa
Isoelectric point according different methods:
Protein with the highest isoelectric point:
>tr|A0A0D7AAF6|A0A0D7AAF6_9AGAR Uncharacterized protein (Fragment) OS=Fistulina hepatica ATCC 64428 OX=1128425 GN=FISHEDRAFT_21244 PE=4 SV=1
TT1 pKa = 7.29PALPHH6 pKa = 6.3SRR8 pKa = 11.84TPALPHH14 pKa = 6.23SRR16 pKa = 11.84TPALPHH22 pKa = 6.23SRR24 pKa = 11.84TPALPHH30 pKa = 6.26SRR32 pKa = 11.84TPTLPHH38 pKa = 6.41SRR40 pKa = 11.84TPALPHH46 pKa = 6.61PRR48 pKa = 11.84TPSLSHH54 pKa = 5.78SHH56 pKa = 5.26TT57 pKa = 3.69
TT1 pKa = 7.29PALPHH6 pKa = 6.3SRR8 pKa = 11.84TPALPHH14 pKa = 6.23SRR16 pKa = 11.84TPALPHH22 pKa = 6.23SRR24 pKa = 11.84TPALPHH30 pKa = 6.26SRR32 pKa = 11.84TPTLPHH38 pKa = 6.41SRR40 pKa = 11.84TPALPHH46 pKa = 6.61PRR48 pKa = 11.84TPSLSHH54 pKa = 5.78SHH56 pKa = 5.26TT57 pKa = 3.69
Molecular weight: 6.17 kDa
Isoelectric point according different methods:
Peptides (in silico digests for buttom-up proteomics)
Below you can find in silico digests of the whole proteome with Trypsin, Chymotrypsin, Trypsin+LysC, LysN, ArgC proteases suitable for different mass spec machines.| Try ESI |
 |
|---|
| ChTry ESI |
 |
|---|
| ArgC ESI |
 |
|---|
| LysN ESI |
 |
|---|
| TryLysC ESI |
 |
|---|
| Try MALDI |
 |
|---|
| ChTry MALDI |
 |
|---|
| ArgC MALDI |
 |
|---|
| LysN MALDI |
 |
|---|
| TryLysC MALDI |
 |
|---|
| Try LTQ |
 |
|---|
| ChTry LTQ |
 |
|---|
| ArgC LTQ |
 |
|---|
| LysN LTQ |
 |
|---|
| TryLysC LTQ |
 |
|---|
| Try MSlow |
 |
|---|
| ChTry MSlow |
 |
|---|
| ArgC MSlow |
 |
|---|
| LysN MSlow |
 |
|---|
| TryLysC MSlow |
 |
|---|
| Try MShigh |
 |
|---|
| ChTry MShigh |
 |
|---|
| ArgC MShigh |
 |
|---|
| LysN MShigh |
 |
|---|
| TryLysC MShigh |
 |
|---|
General Statistics
Number of major isoforms |
Number of additional isoforms |
Number of all proteins |
Number of amino acids |
Min. Seq. Length |
Max. Seq. Length |
Avg. Seq. Length |
Avg. Mol. Weight |
|---|---|---|---|---|---|---|---|
0 |
3775801 |
49 |
3562 |
405.0 |
44.88 |
Amino acid frequency
Ala |
Cys |
Asp |
Glu |
Phe |
Gly |
His |
Ile |
Lys |
Leu |
|---|---|---|---|---|---|---|---|---|---|
8.76 ± 0.025 | 1.437 ± 0.009 |
5.867 ± 0.02 | 5.677 ± 0.023 |
3.821 ± 0.015 | 6.177 ± 0.022 |
2.669 ± 0.01 | 4.838 ± 0.017 |
4.166 ± 0.023 | 9.214 ± 0.027 |
Met |
Asn |
Gln |
Pro |
Arg |
Ser |
Thr |
Val |
Trp |
Tyr |
|---|---|---|---|---|---|---|---|---|---|
2.212 ± 0.011 | 3.328 ± 0.012 |
6.245 ± 0.028 | 3.584 ± 0.016 |
6.408 ± 0.024 | 8.535 ± 0.035 |
6.012 ± 0.021 | 6.754 ± 0.018 |
1.462 ± 0.009 | 2.835 ± 0.015 |
Most of the basic statistics you can see at this page can be downloaded from this CSV file
Proteome-pI is available under Creative Commons Attribution-NoDerivs license, for more details see here
| Reference: Kozlowski LP. Proteome-pI 2.0: Proteome Isoelectric Point Database Update. Nucleic Acids Res. 2021, doi: 10.1093/nar/gkab944 | Contact: Lukasz P. Kozlowski |
